Sunteck Realty Limited's management explains the business in its own materials. The slides below do the most of that work, pulled from the documents preserved in Sources. Each source link opens the complete presentation at that slide in a new tab.
The latest full-year deck maps the portfolio, pipeline, operating cash flow and capital structure. · Open the full document →
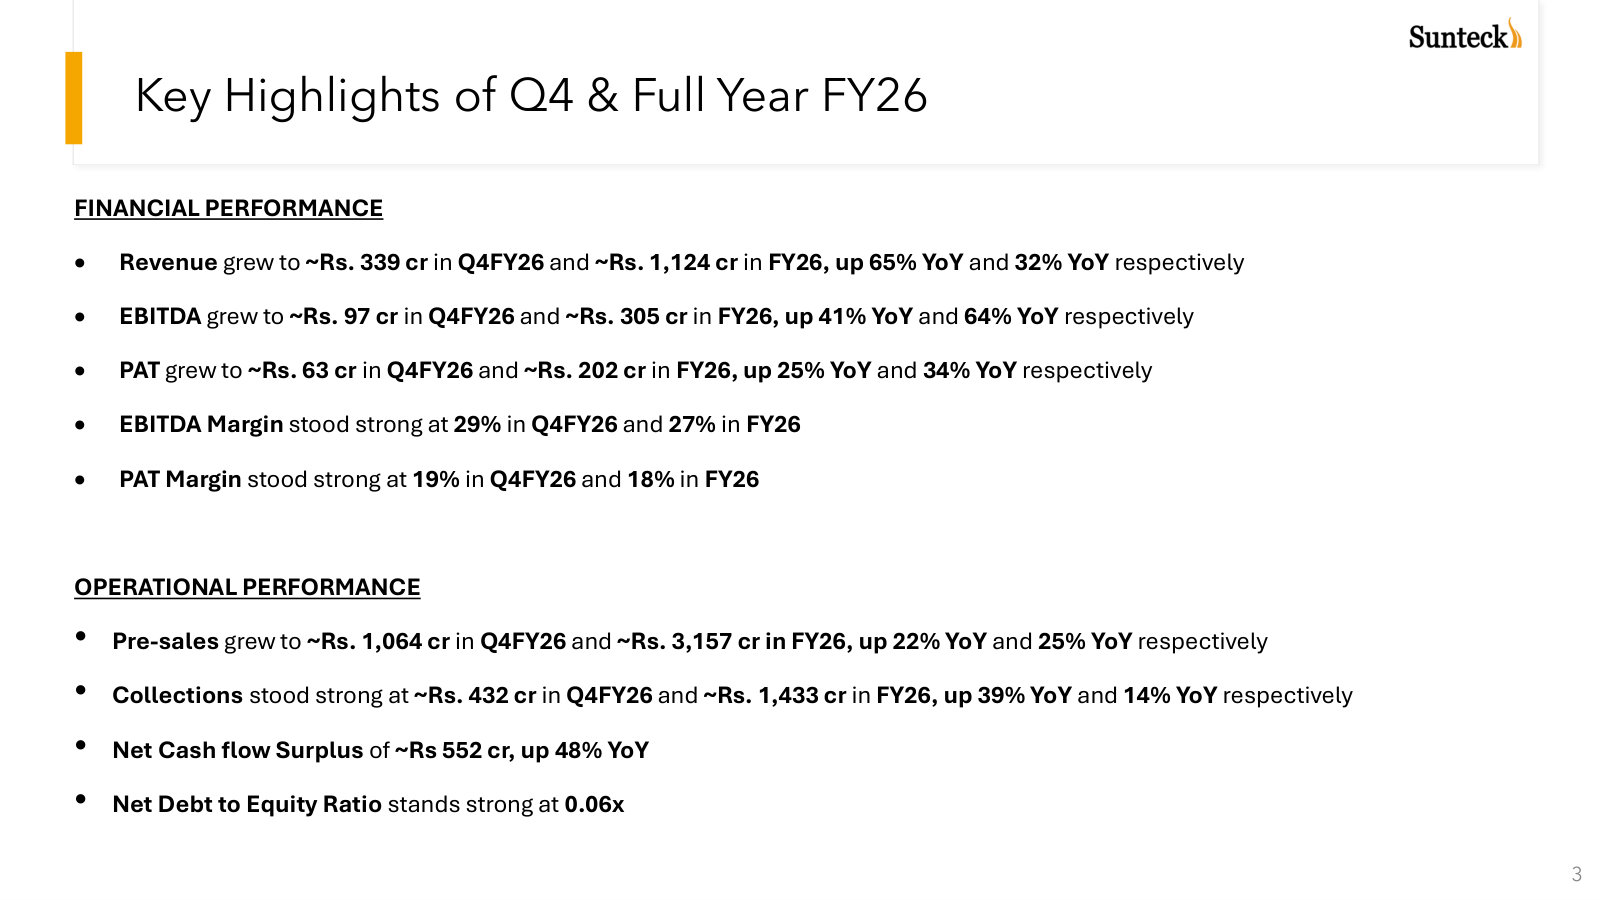
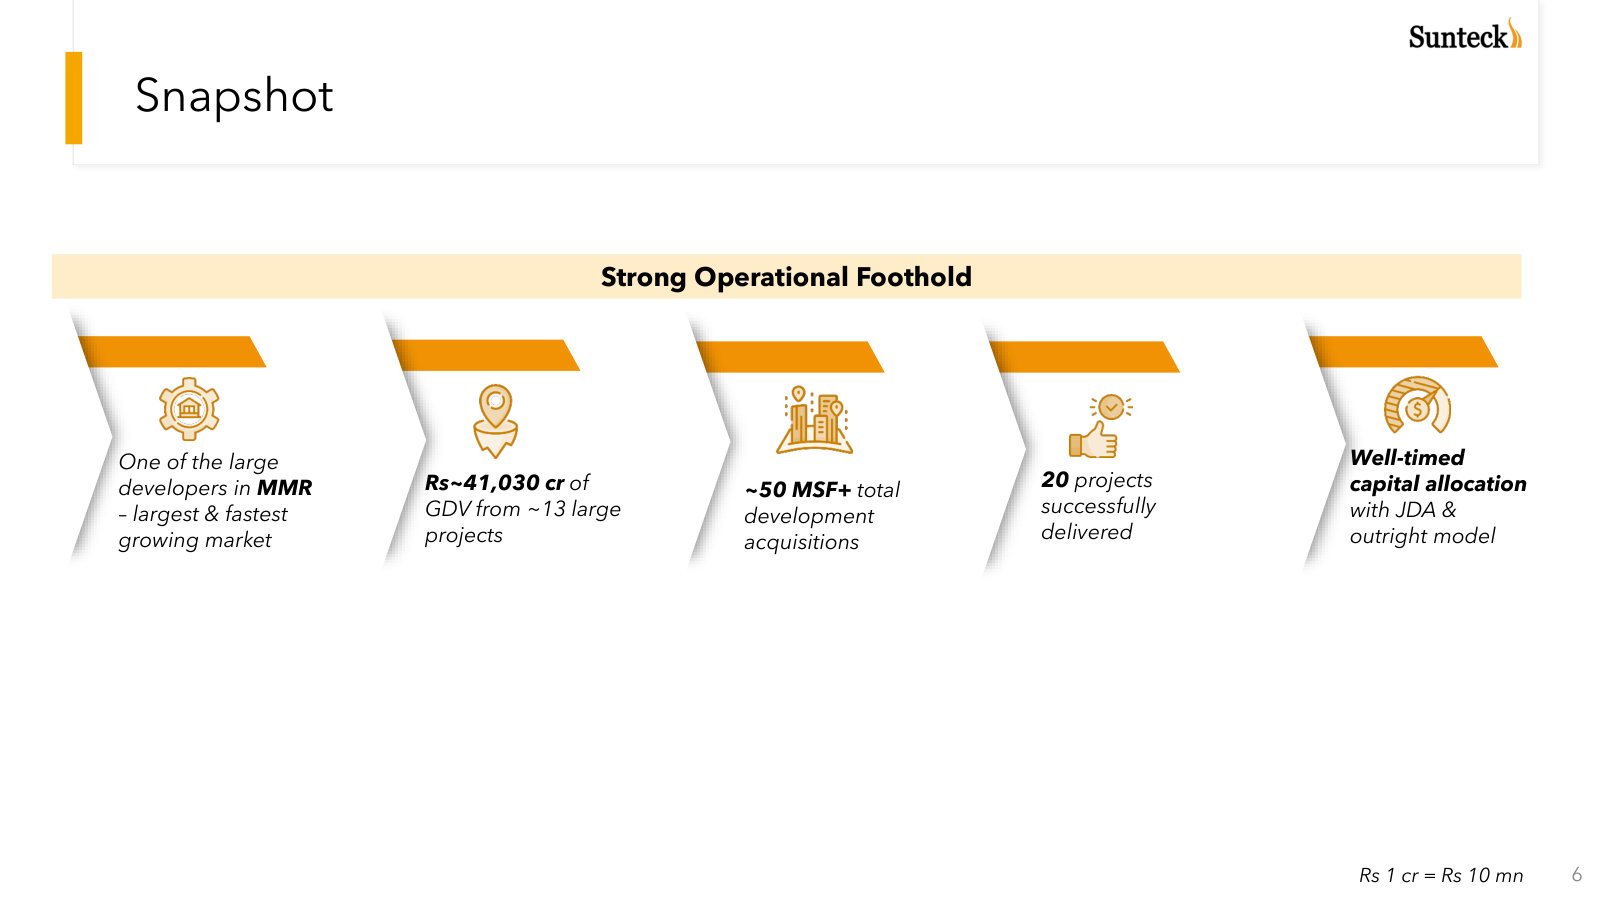
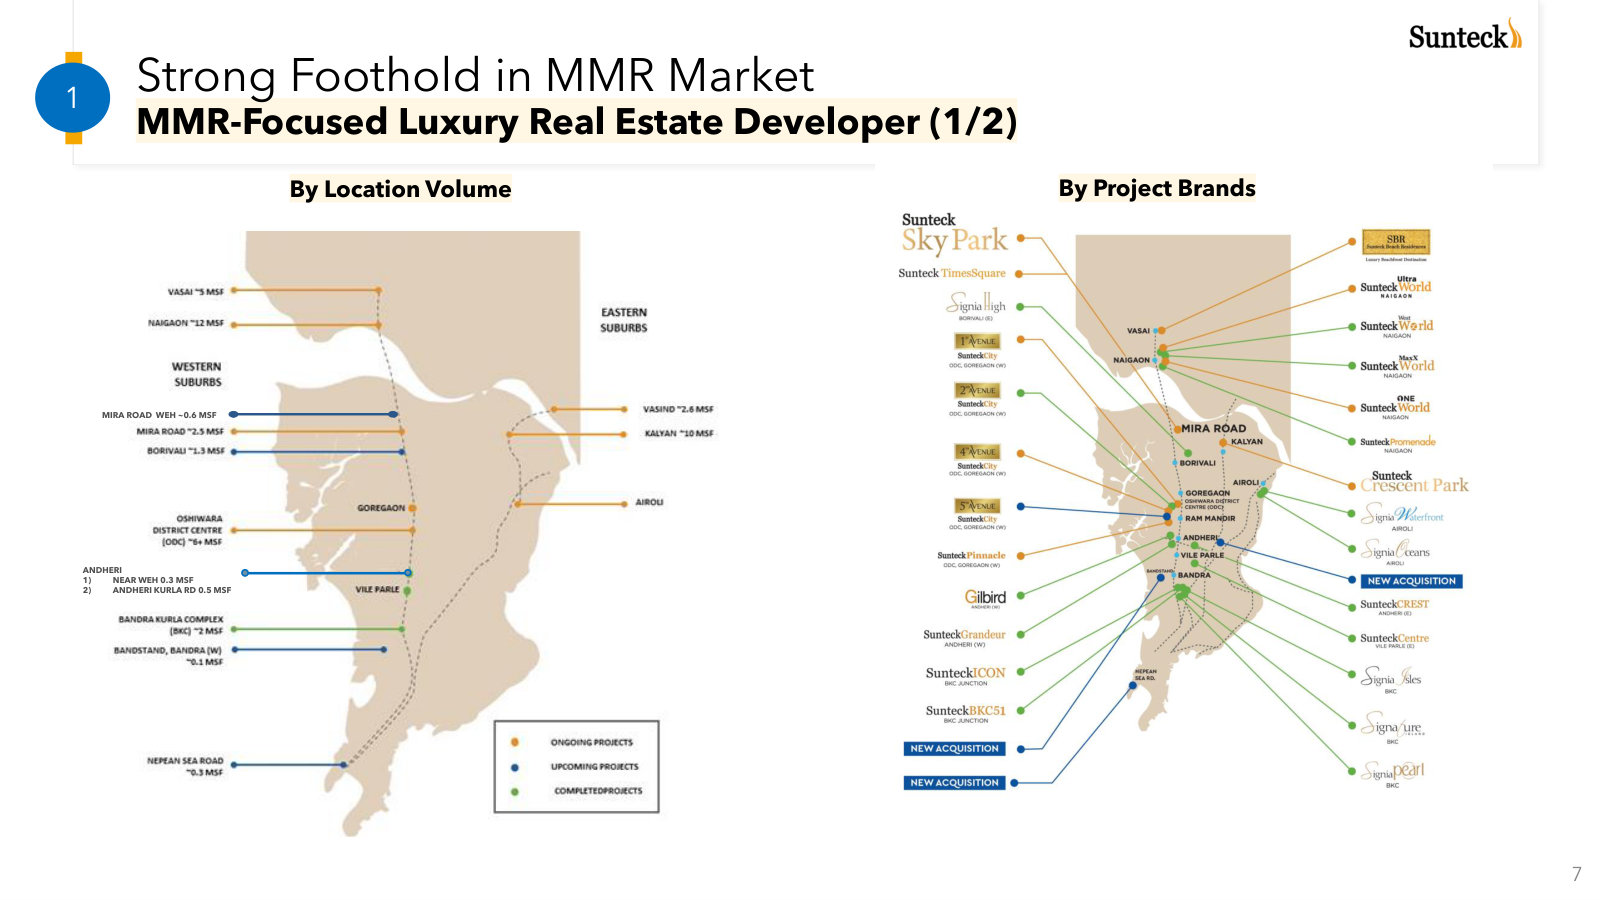
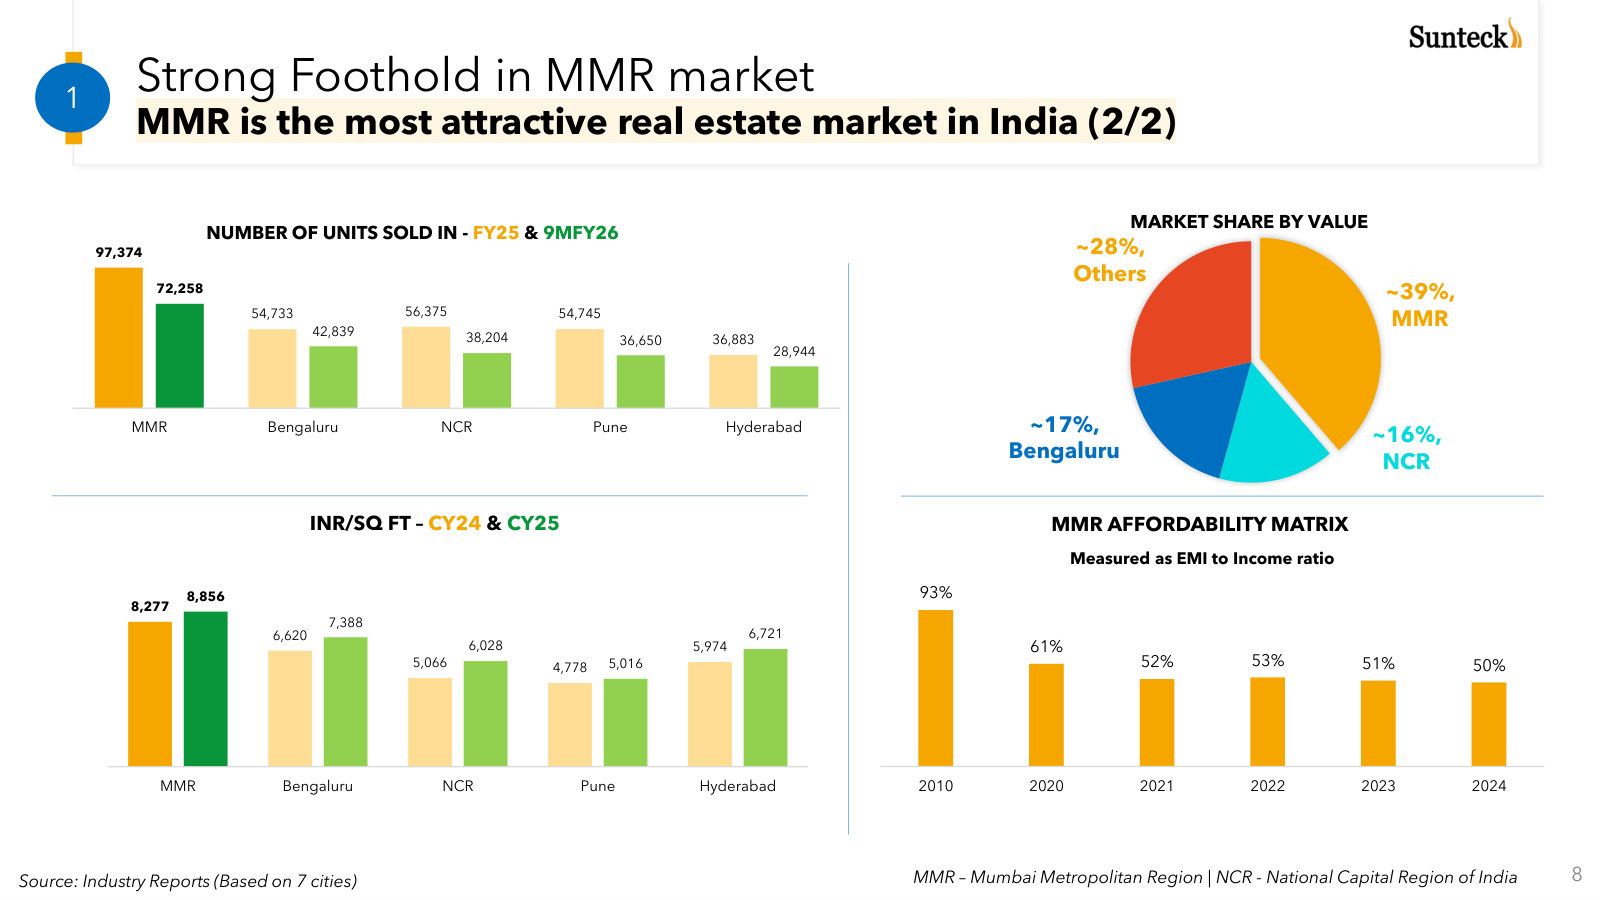
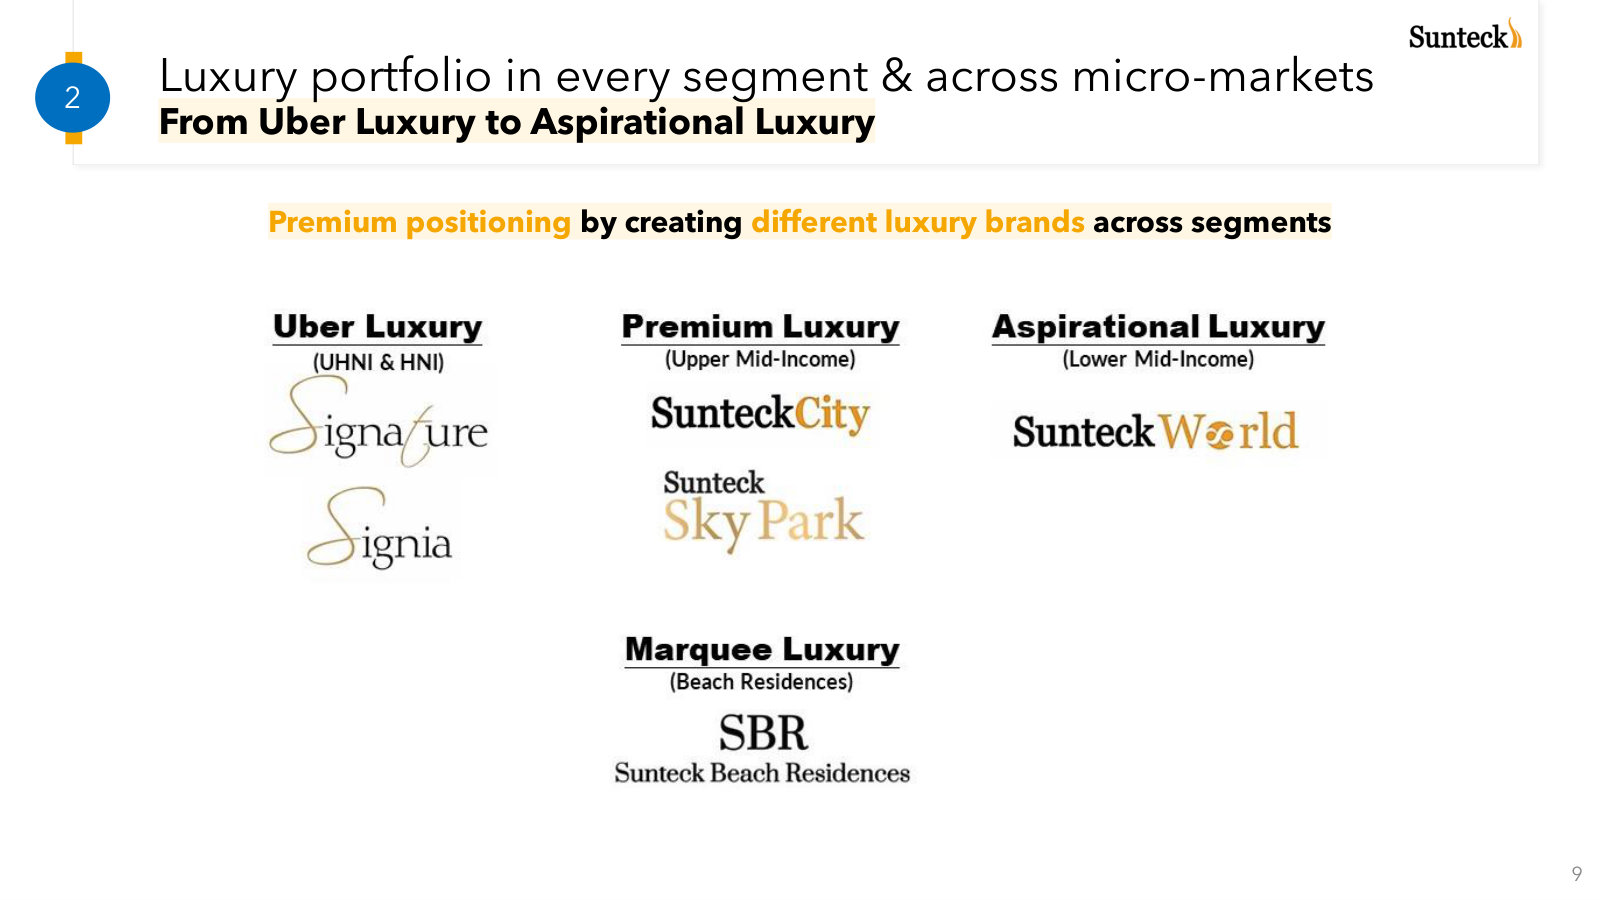
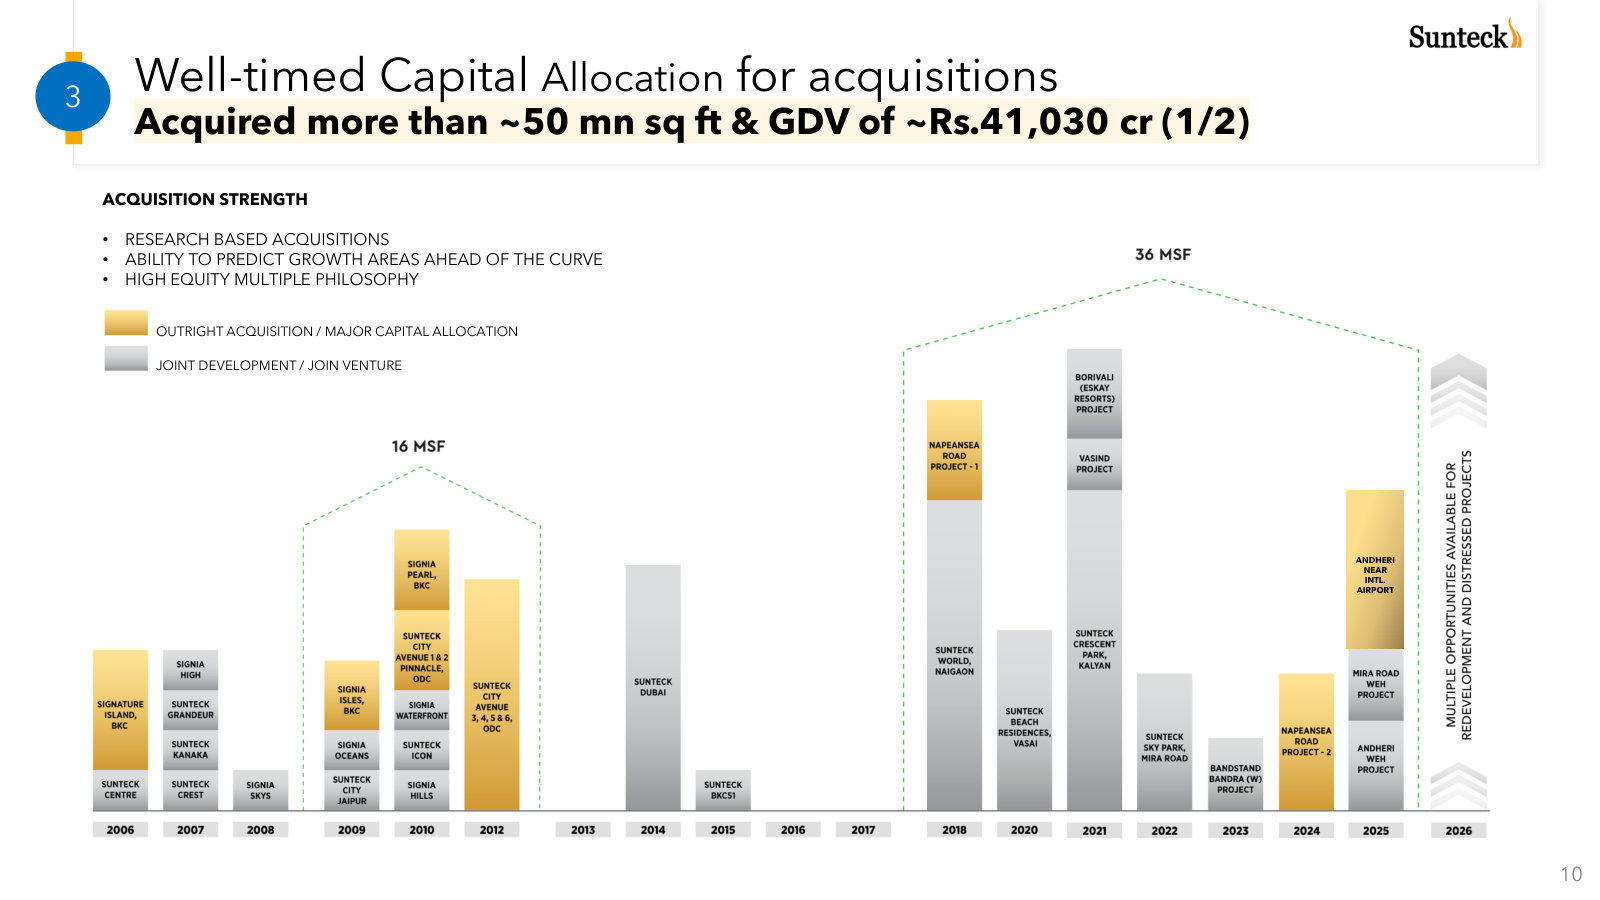
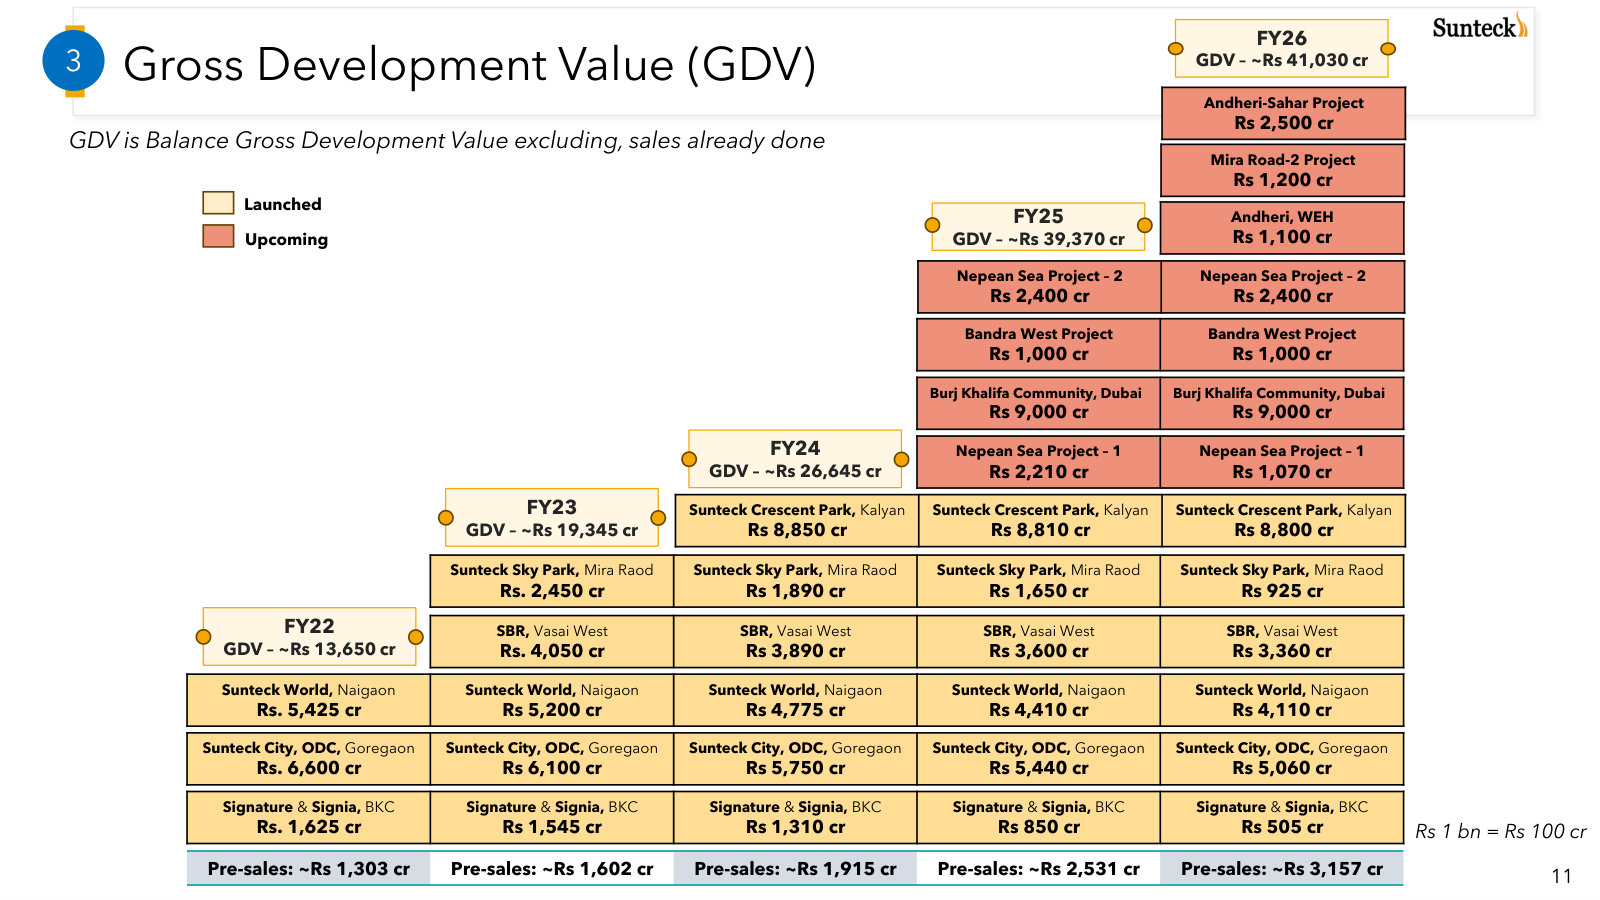
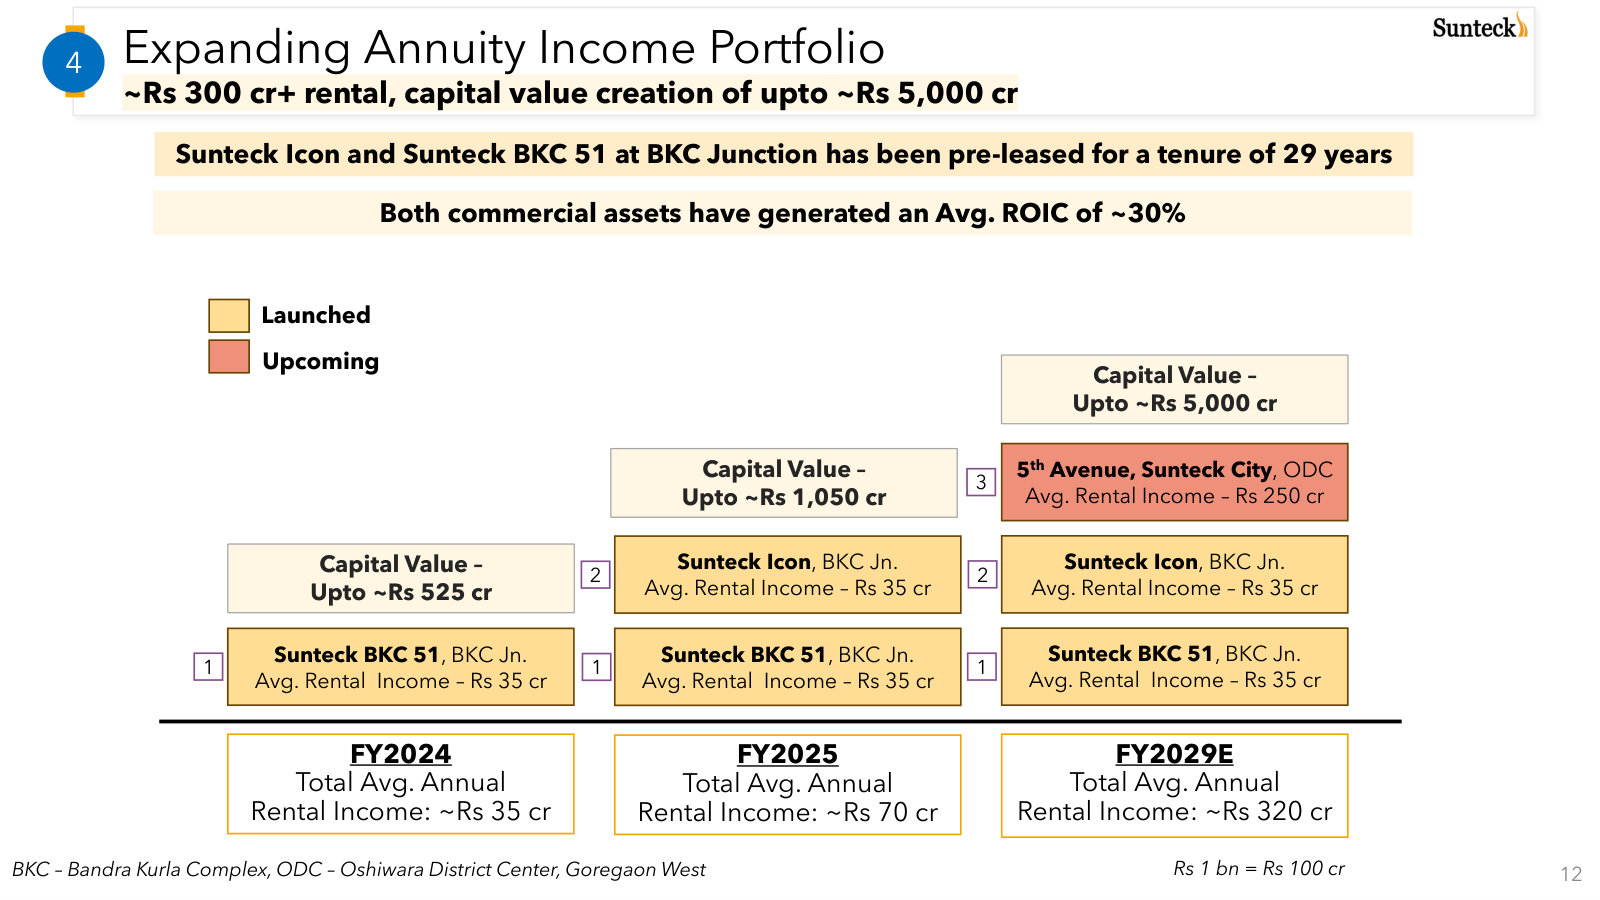
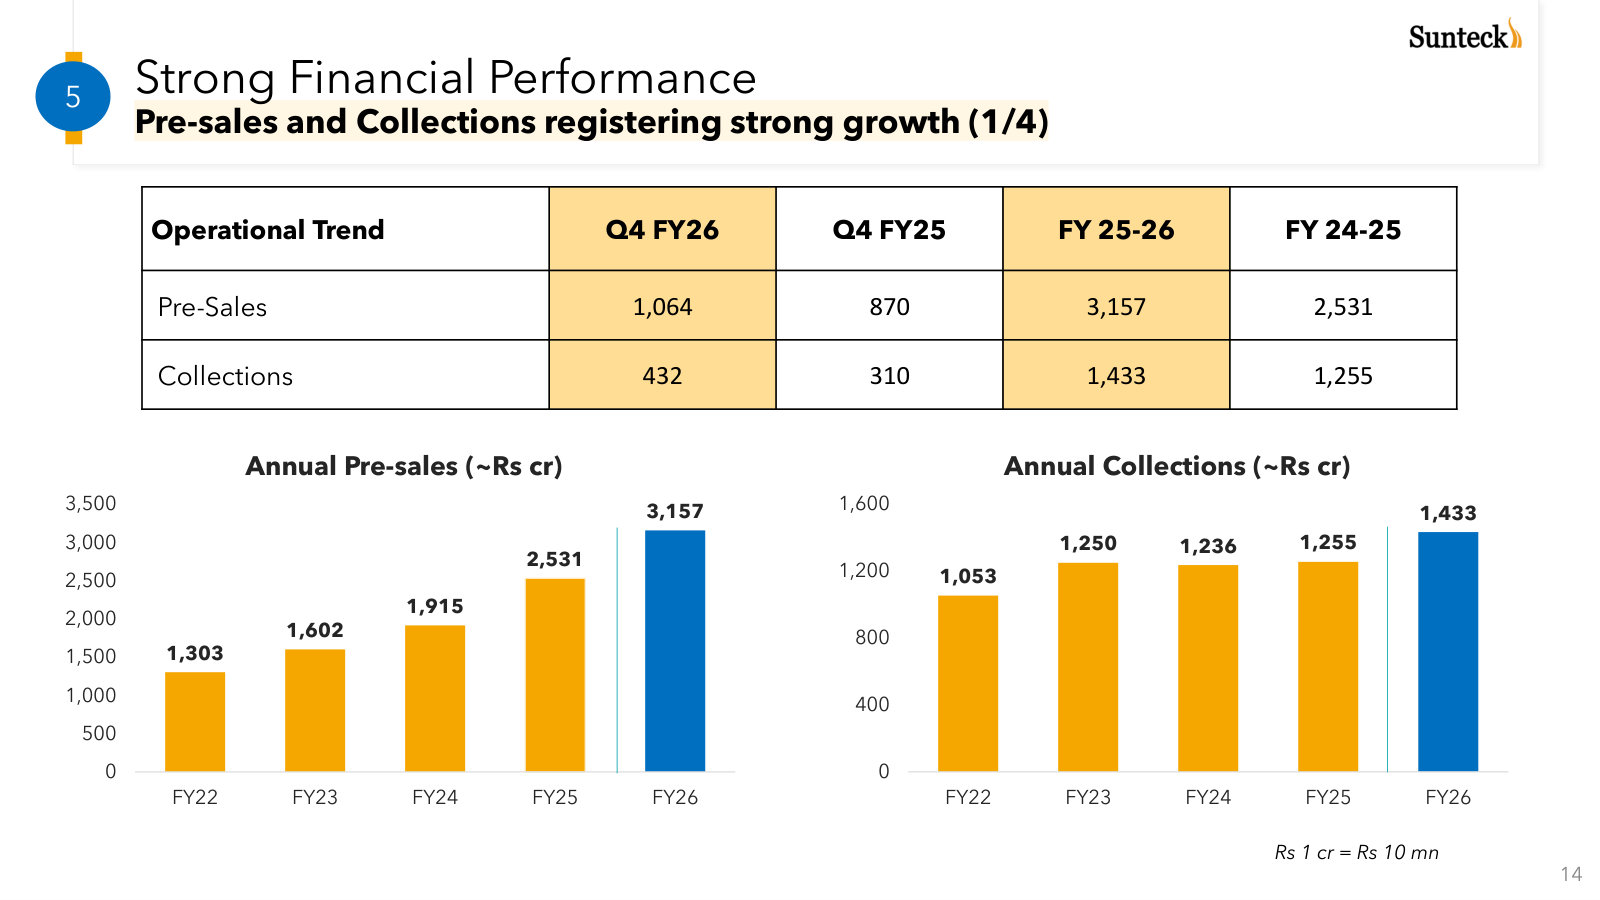
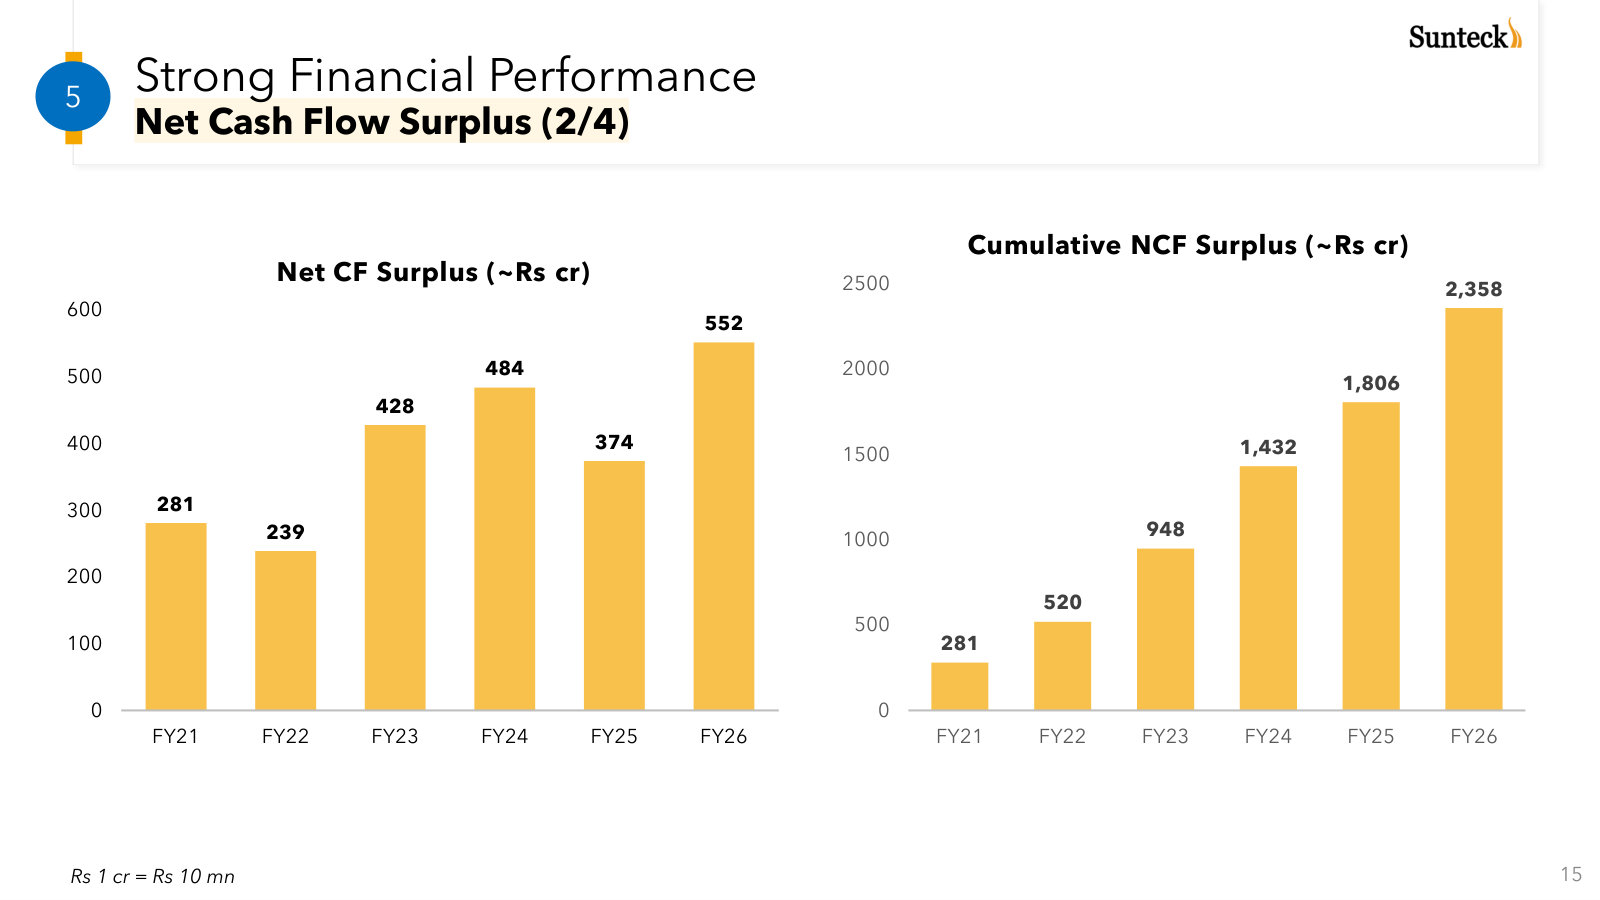
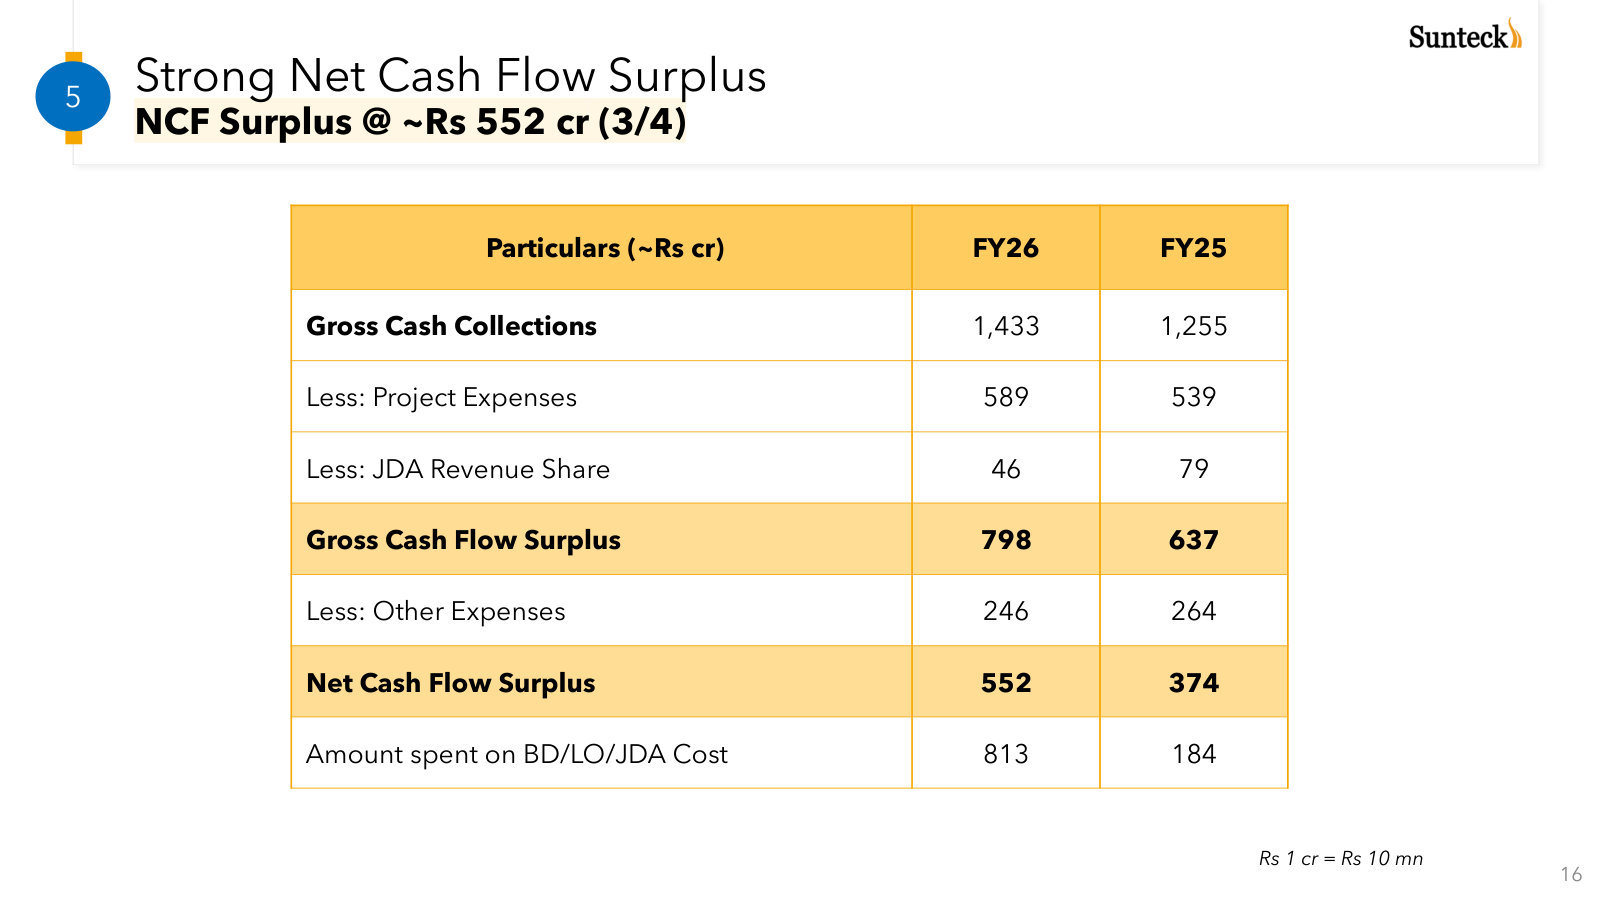
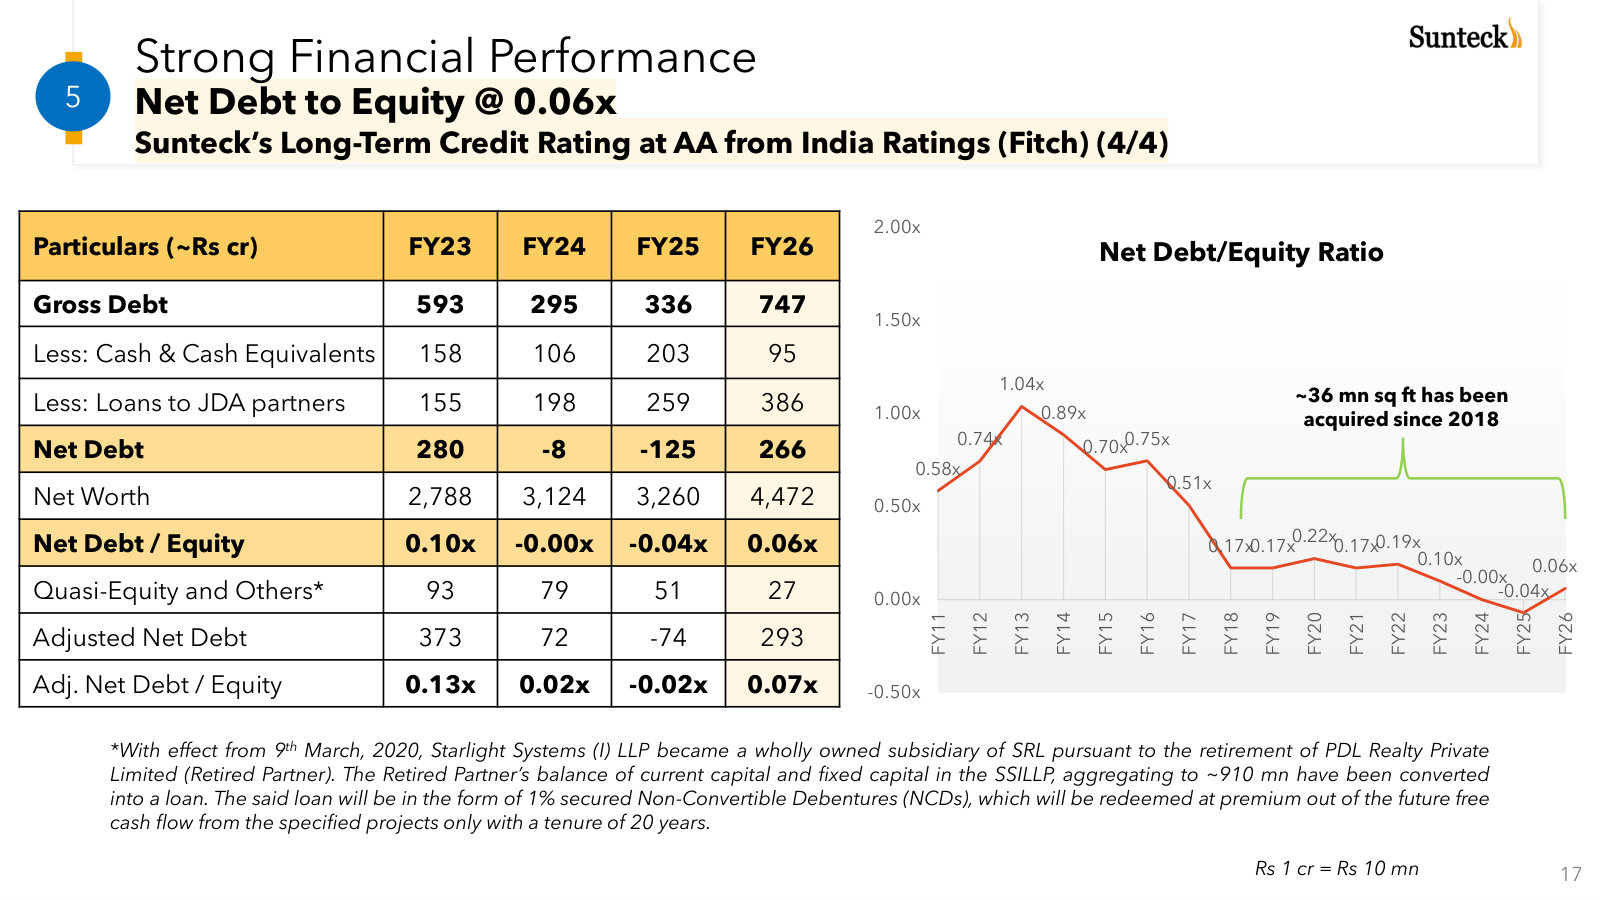
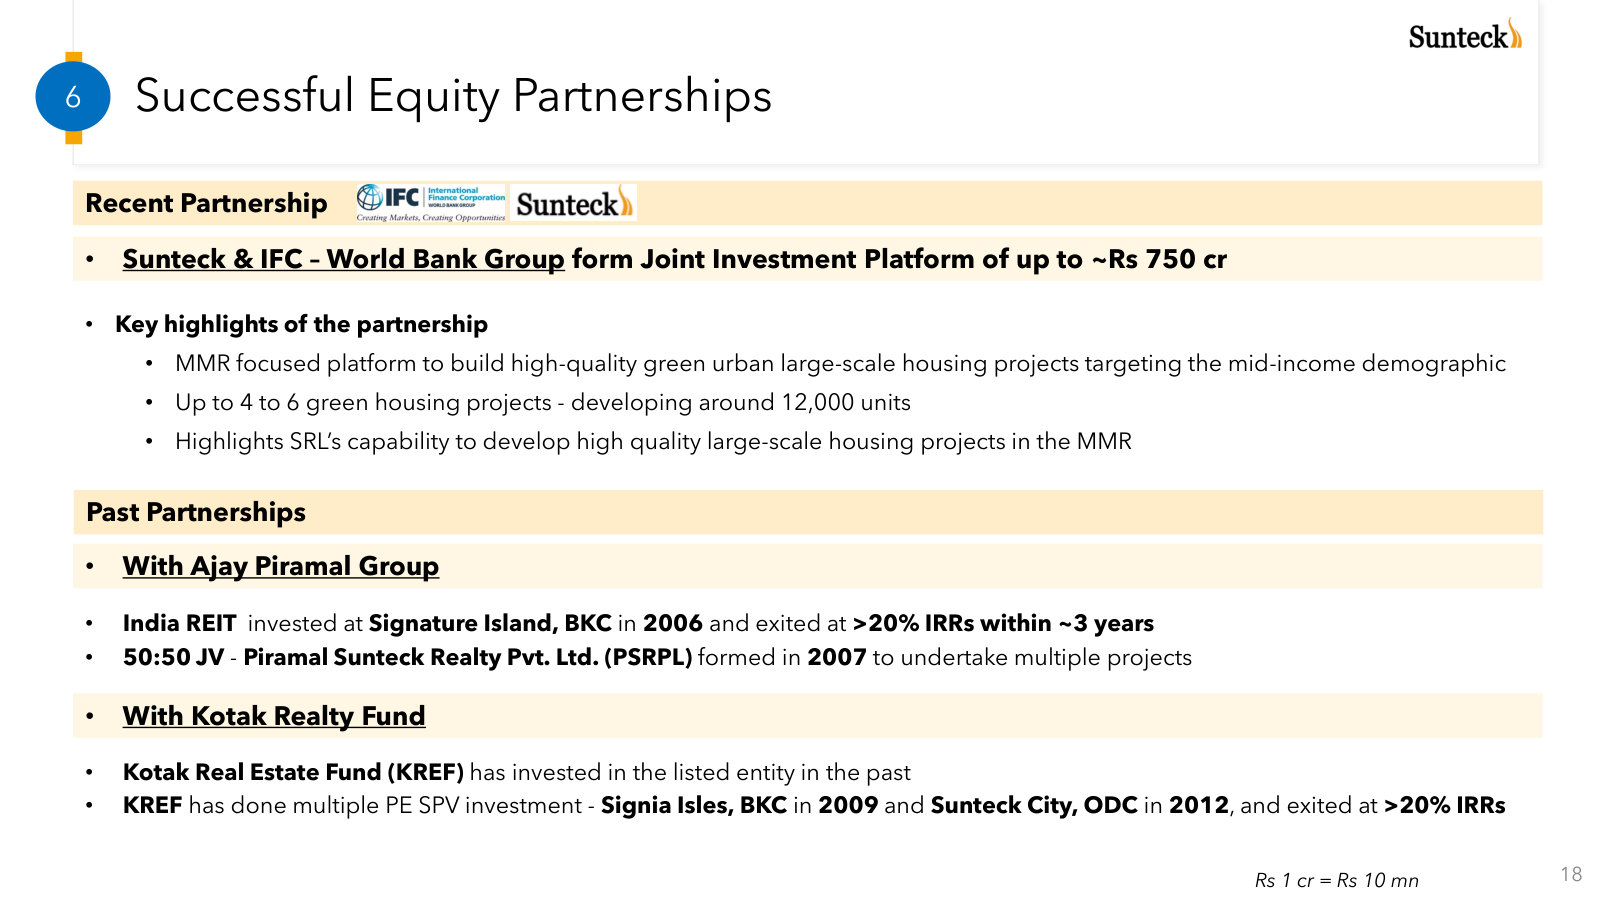
p. 4 — The latest full-year scorecard: revenue, margins, pre-sales, collections, cash surplus and leverage in one place. · Open the full presentation →p. 7 — The company at a glance: MMR focus, project scale, delivery record and its mix of joint development and outright ownership. · Open the full presentation →p. 8 — Where Sunteck builds across Mumbai, with projects mapped by location, brand and stage. · Open the full presentation →p. 9 — Why management focuses on MMR: unit volumes, selling prices, national value share and housing affordability. · Open the full presentation →p. 10 — How the brands span buyer tiers, from Signature at the top end to Sunteck World for lower mid-income buyers. · Open the full presentation →p. 11 — Two decades of acquisitions, separating outright capital commitments from joint-development and JV projects. · Open the full presentation →p. 12 — The current GDV bridge: launched projects, upcoming projects and the pre-sales base from FY22 to FY26. · Open the full presentation →p. 13 — How commercial assets build rental income and capital value, including the planned step-up through FY29. · Open the full presentation →p. 15 — Five years of pre-sales and collections, the operating metrics that lead reported revenue for a developer. · Open the full presentation →p. 16 — Annual and cumulative net cash-flow surplus, management's preferred measure of operating cash generation. · Open the full presentation →p. 17 — The FY26 cash bridge from customer collections through project costs, JDA shares and overhead. · Open the full presentation →p. 18 — Debt, cash and partner loans reconcile to net leverage, with the long-run debt-to-equity trend beside them. · Open the full presentation →p. 19 — How Sunteck uses outside capital: the IFC housing platform and earlier Piramal and Kotak partnerships. · Open the full presentation →
The only deck that sets out the economics and market rationale for Sunteck's Dubai project. · Open the full document →
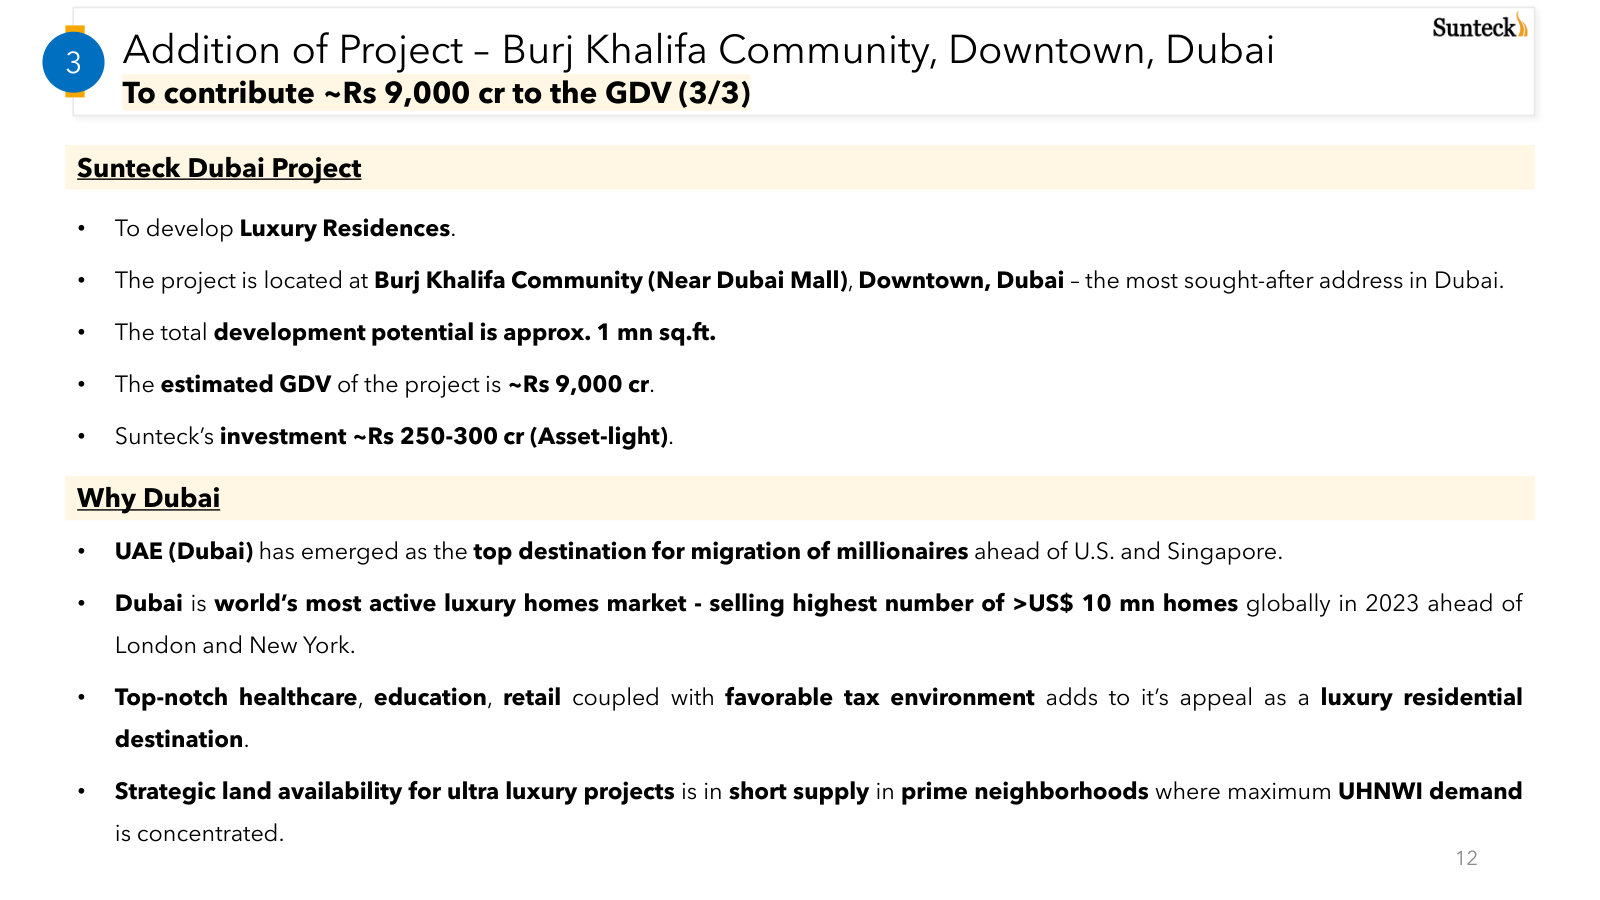
p. 13 — The Dubai expansion: location, 1 msf of potential, ₹9,000 crore GDV, ₹250–300 crore investment and the market case. · Open the full presentation →
An older but unusually detailed deck on pipeline cash, revenue recognition and project-level returns. · Open the full document →
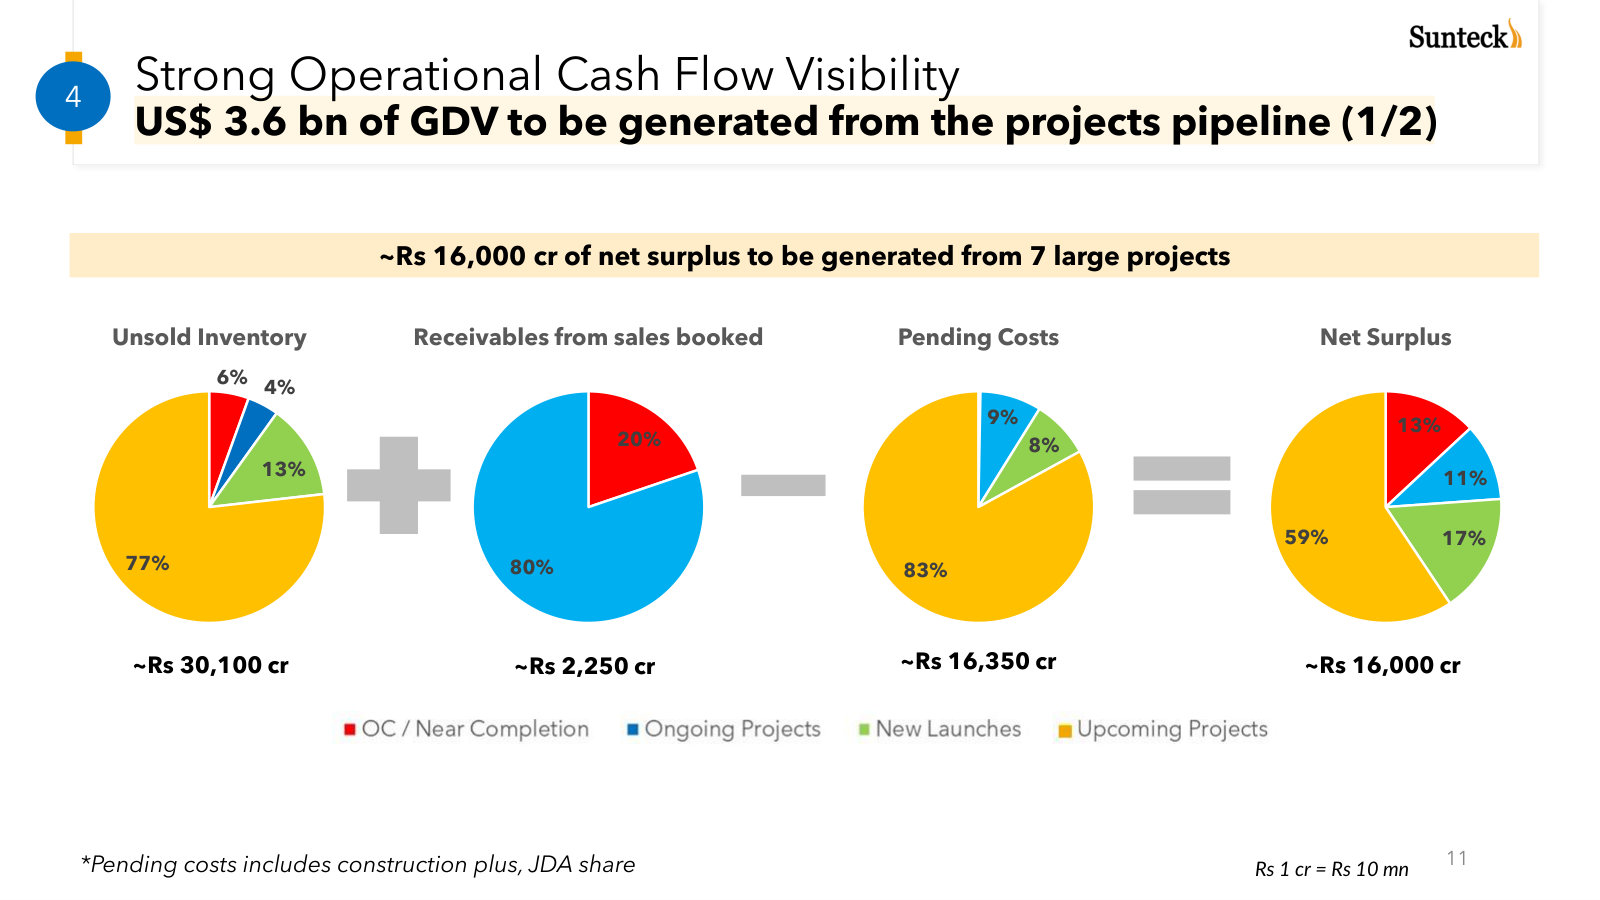
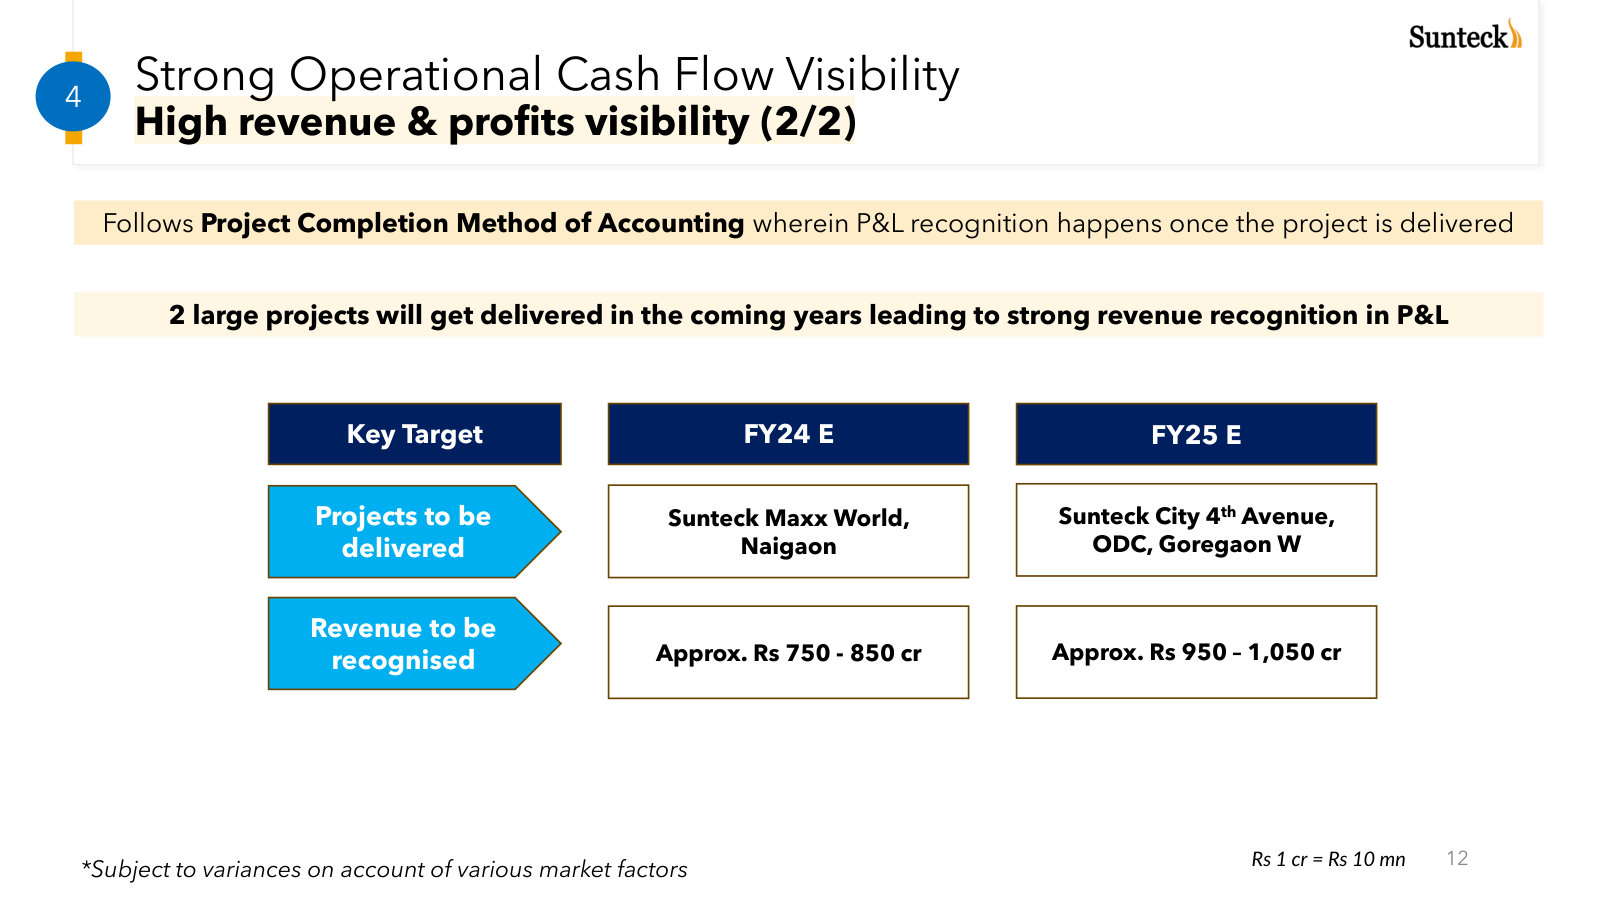
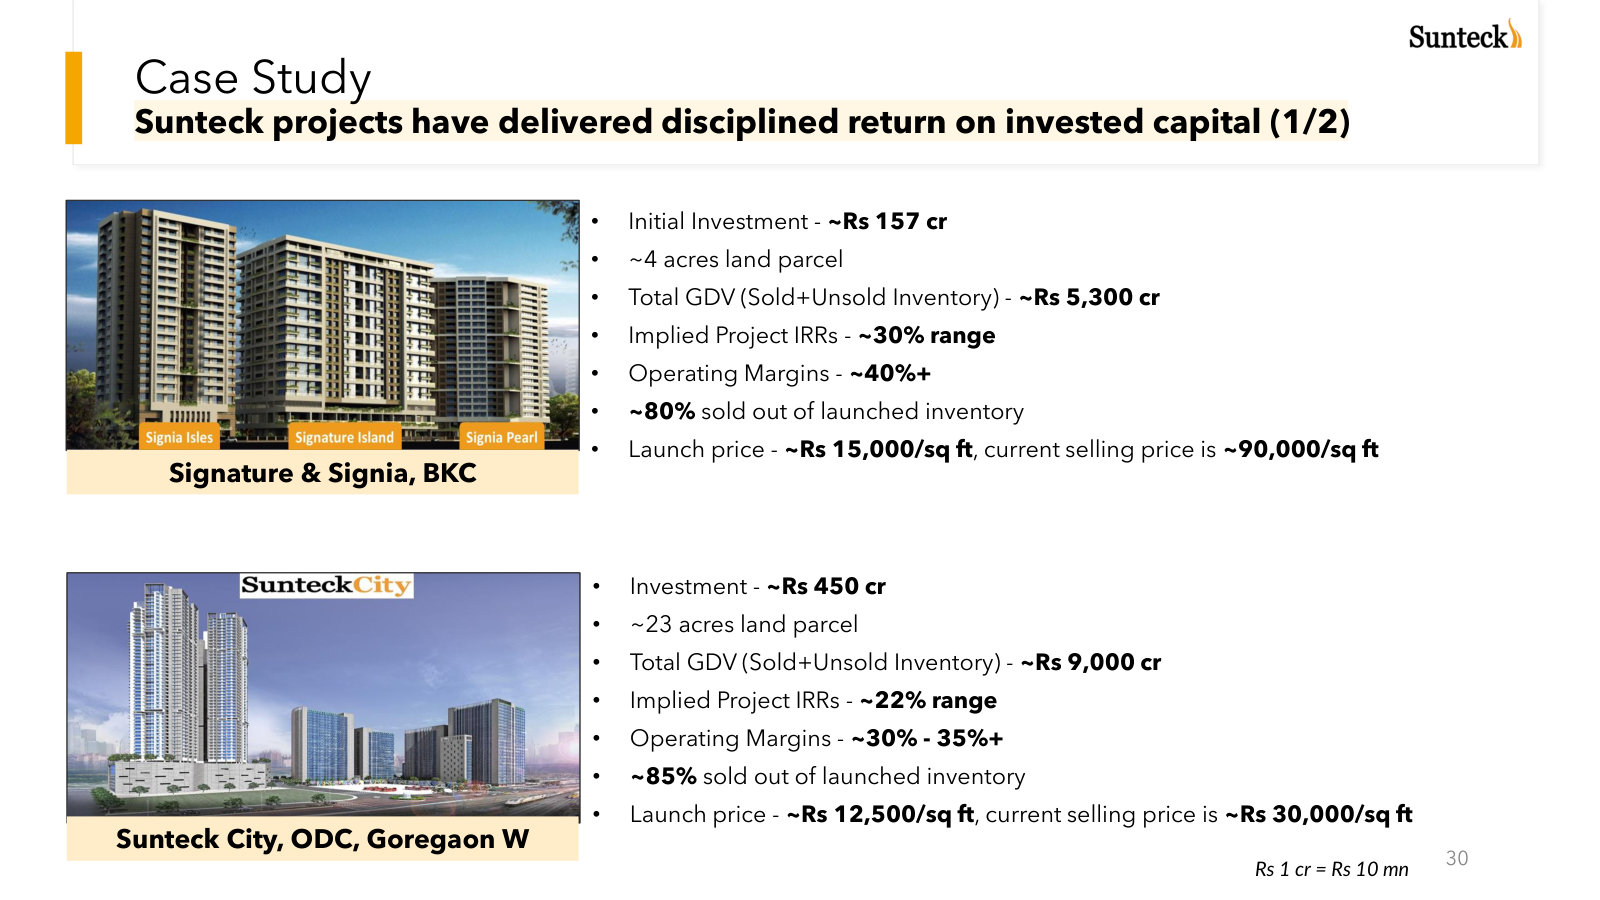
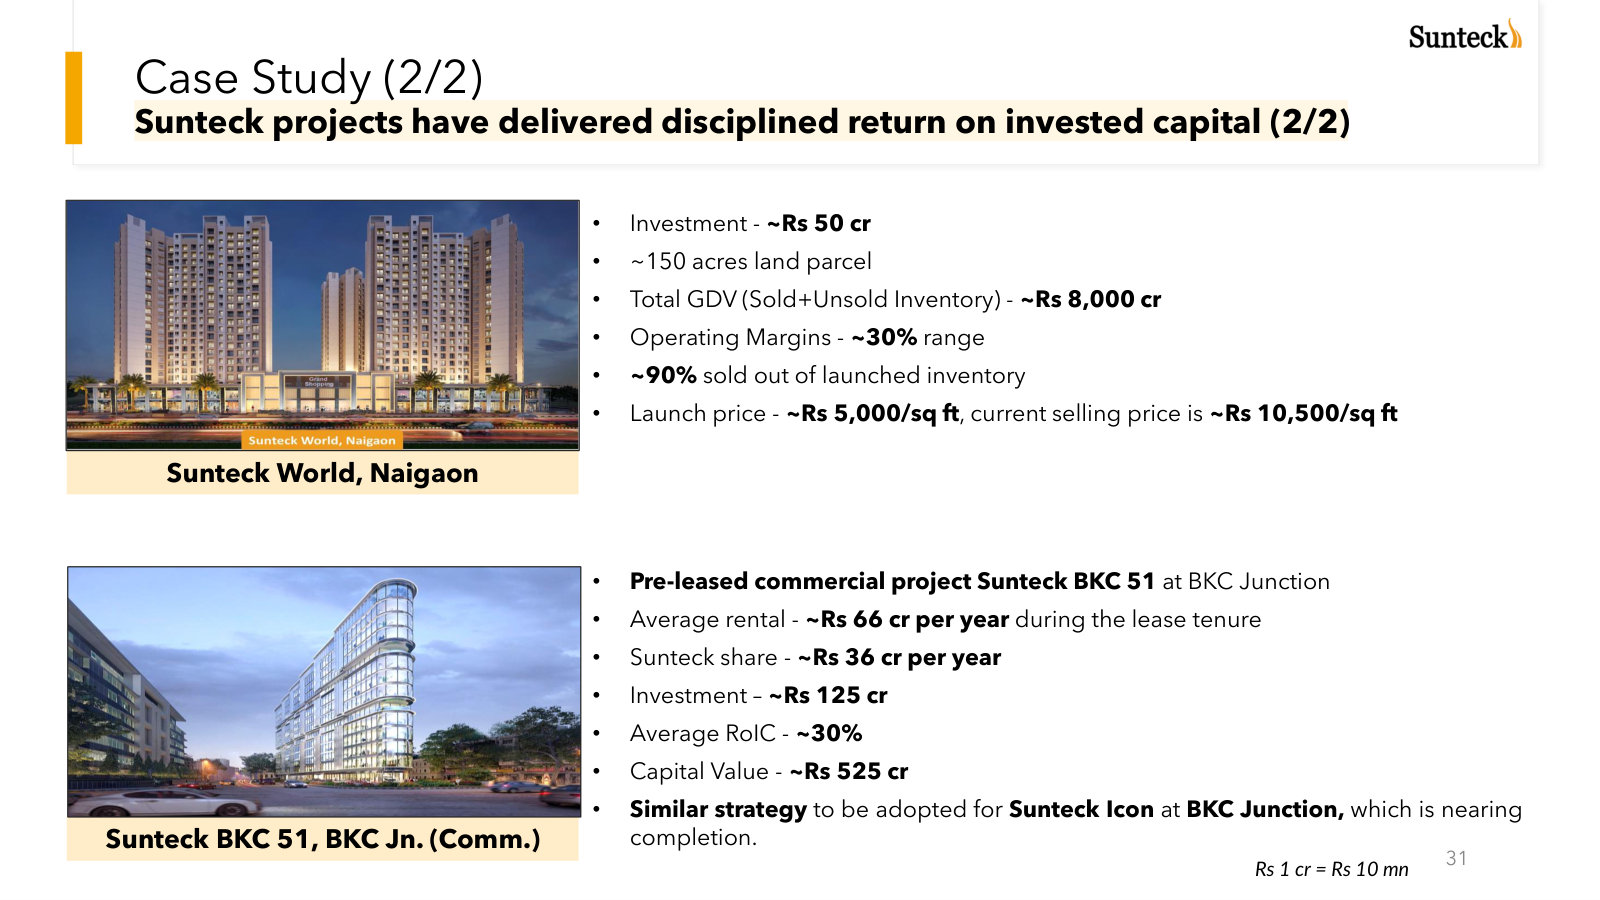
p. 12 — Management's 2023 bridge from unsold inventory and receivables through remaining costs to projected portfolio surplus. · Open the full presentation →p. 13 — Why pre-sales and cash can precede reported revenue under project-completion accounting; the targets shown are from 2023. · Open the full presentation →p. 31 — BKC and Goregaon cases with land cost, GDV, implied IRR, operating margin, sell-through and price appreciation. · Open the full presentation →p. 32 — Naigaon residential economics beside the BKC 51 commercial model, including investment, rent, RoIC and capital value. · Open the full presentation →