Full Report
Figures converted from INR to USD at historical FX rates (frankfurter.app). Monetary statements are shown in US$ millions; per-share figures use the matching period rate. Filing links open the native figures from which each USD value was derived.
The numbers behind Sunteck Realty Limited: as-reported financial statements and company metrics for FY2021–FY2025, traced to the source filings, opened with the share-price history those statements have to justify. Every linked USD figure opens the exact filing row containing the native reported value from which it was converted. Amounts in US$ millions unless noted.
Reading notes: FY2021–FY2025 main-statement values use each fiscal year's own consolidated annual report; FY2020 long-term values use the explicitly restated comparative column in the FY2021 annual report. FY2019 income-statement values are standardized provider data and are unlinked; FY2019 total equity uses the restated 1 April 2019 balance printed in the FY2021 annual report. Sunteck reports one operating segment—Real Estate/Real Estate Development and Related Activities—so the revenue mix uses the filing's revenue-from-operations disaggregation rather than an invented segment split. The FY2024 revenue-note components total ₹56,494.28 lakhs, ₹9.60 lakhs above the printed ₹56,484.68 lakh total; all filed figures are preserved and the total-row check intentionally exposes the variance.
Share Price — Full Available History — 16 Years
The stock closed at $3.27 on Jul 21, 2026 — down 12% over the window shown (-0.8% a year), trading between $1.37 and $7.99. At that close the stock trades at 27× FY2025 diluted EPS as reported below.
Source: market price feed, monthly closes, sampled from 4,076 source observations, Feb 2010–Jul 2026. Price return only, excludes dividends. Prices are split-adjusted (1:2 on Jul 25, 2017). Prices converted from INR to USD with date-matched or nearest-available FX.
FY2025 at a Glance
Net income (US$ millions)
Diluted EPS
Source: FY2025 consolidated statements [1] [2] [3] [4]. Click any linked figure to open the filing page with the row highlighted.
Revenue from Operations by Source
| Revenue from Operations by Source | FY2021 | FY2022 | FY2023 | FY2024 | FY2025 |
|---|---|---|---|---|---|
| Sales of residential and commercial units (net) | 754.97 | 579.87 | 353.64 | 571.49 | 909.36 |
| Rent from properties | 10.76 | 10.96 | 11.41 | 44.11 | 58.43 |
| Construction | 37.50 | 59.07 | 41.21 | 27.84 | 0.58 |
| Maintenance | 17.17 | 16.06 | 22.14 | 27.19 | 23.54 |
| Forfeiture income | 11.20 | 5.01 | 5.68 | 3.61 | 3.26 |
| Sundry balances written back (net) | 6.95 | 5.36 | 1.34 | 0.31 | — |
| Excess provision written back - Share based payment | — | 0.73 | — | 0.00 | — |
| Excess provision written back - Others | — | — | 3.32 | 1.21 | — |
| Others | — | 0.20 | 1.99 | 1.61 | 2.99 |
| Total | 838.54 | 677.26 | 440.74 | 677.25 | 998.17 |
Source: Notes 30 and 32 to the consolidated financial statements; the Group reports one operating segment and no separate reportable segments. [5] [6] [7] [8]. Click any linked figure to open the filing page with the row highlighted.
Income Statement
Source: Consolidated Statement of Profit and Loss [1] [2] [3] [4]. Click any linked figure to open the filing page with the row highlighted.
Columns marked E are consensus analyst estimates from Yahoo Finance, shown alongside reported results for direct comparison; they are not company guidance.
Estimate source: Yahoo Finance analyst consensus, as of 2026-07-21. Estimate figures link to the consensus source, not to filing pages.
Balance Sheet
| Balance Sheet | FY2021 | FY2022 | FY2023 | FY2024 | FY2025 |
|---|---|---|---|---|---|
| Property, plant and equipment | 45.65 | 62.52 | 63.52 | 77.66 | 84.50 |
| Investment properties | 26.54 | 99.04 | 117.62 | 507.60 | 494.64 |
| Total non-current assets | 533.16 | 665.71 | 809.37 | 1,233.18 | 1,200.33 |
| Inventories | 3,571.35 | 5,335.30 | 6,961.74 | 7,153.58 | 7,261.49 |
| Trade receivables | 457.83 | 357.09 | 181.93 | 350.74 | 137.42 |
| Cash and cash equivalents | 70.48 | 85.19 | 108.00 | 71.58 | 191.92 |
| Total current assets | 5,009.07 | 6,592.80 | 8,017.12 | 8,267.27 | 8,541.73 |
| Total assets | 5,542.23 | 7,258.51 | 8,826.49 | 9,500.45 | 9,742.07 |
| Total equity | 3,786.89 | 3,683.33 | 3,390.03 | 3,745.91 | 3,814.24 |
| Borrowings (non-current) | 753.98 | 580.57 | 511.74 | 300.55 | 181.98 |
| Borrowings (current) | 139.86 | 458.20 | 321.73 | 149.00 | 270.74 |
| Liabilities towards land owners for joint development arrangements | — | — | 3,183.96 | 3,368.01 | 3,575.77 |
| Total current liabilities | 994.07 | 2,971.97 | 4,906.45 | 5,417.81 | 5,712.43 |
| Total liabilities | 1,755.33 | 3,575.18 | 5,436.46 | 5,754.54 | 5,927.83 |
Source: Consolidated Balance Sheet; current and non-current qualifiers distinguish the two printed Borrowings rows. [9] [10] [11] [12]. Click any linked figure to open the filing page with the row highlighted.
Cash Flow
| Cash Flow | FY2021 | FY2022 | FY2023 | FY2024 | FY2025 |
|---|---|---|---|---|---|
| Net cash generated from operating activities - [A] | 390.88 | (40.83) | 318.65 | 130.68 | 222.11 |
| Purchase of property, plant and equipment, investment properties and intangible assets | (22.48) | (24.11) | (22.03) | (75.72) | (38.05) |
| Net cash (used in)/ generated from investing activities - [B] | 19.78 | 43.99 | (19.75) | 301.06 | (42.94) |
| Dividends paid | (19.35) | (18.74) | (25.61) | (25.27) | (25.72) |
| Net cash used in financing activities - [C] | (453.87) | 60.58 | (317.84) | (422.90) | (121.07) |
| Net increase/ (decrease) in cash and cash equivalents - [A+B+C] | (43.21) | 63.75 | (18.94) | 8.84 | 58.10 |
| Cash and cash equivalents at the end of the year | 70.48 | 77.37 | 34.38 | 42.74 | 99.81 |
| Free cash flow, derived | 368 | (65) | 297 | 55 | 184 |
Source: Consolidated Statement of Cash Flow; values preserve the filing's printed signs. [13] [14] [15] [16]. Click any linked figure to open the filing page with the row highlighted.
Pre-Sales and Collections
| Pre-Sales and Collections | FY2021 | FY2022 | FY2023 | FY2024 | FY2025 |
|---|---|---|---|---|---|
| Annual pre-sales | 1,396 | 1,720 | 1,948 | 2,296 | 2,961 |
| Annual collections | 1,065 | 1,390 | 1,520 | 1,482 | 1,468 |
| Pre-sales YoY growth | — | — | — | — | 32.0% |
| Collections YoY growth | — | — | — | — | 2.0% |
Source: company filings [17]. Click any linked figure to open the filing page with the row highlighted.
Net Cash Flow Surplus
| Net Cash Flow Surplus | FY2021 | FY2022 | FY2023 | FY2024 | FY2025 |
|---|---|---|---|---|---|
| Net cash flow surplus | 384 | 315 | 520 | 580 | 438 |
| Cumulative NOCF surplus | 384 | 686 | 1,153 | 1,717 | 2,113 |
| Cashflow RoCE | 15.0% | 12.0% | 22.0% | 21.0% | 16.0% |
| Gross operating cash flow surplus | — | — | — | — | 745 |
| Amount spent on BD/LO/JDA cost | — | — | — | — | 215 |
| NOCF surplus post capex | — | — | — | — | 222 |
Source: company filings [18] [19]. Click any linked figure to open the filing page with the row highlighted.
Gross Development Value and Annuity Income
| Gross Development Value and Annuity Income | FY2021 | FY2022 | FY2023 | FY2024 | FY2025 |
|---|---|---|---|---|---|
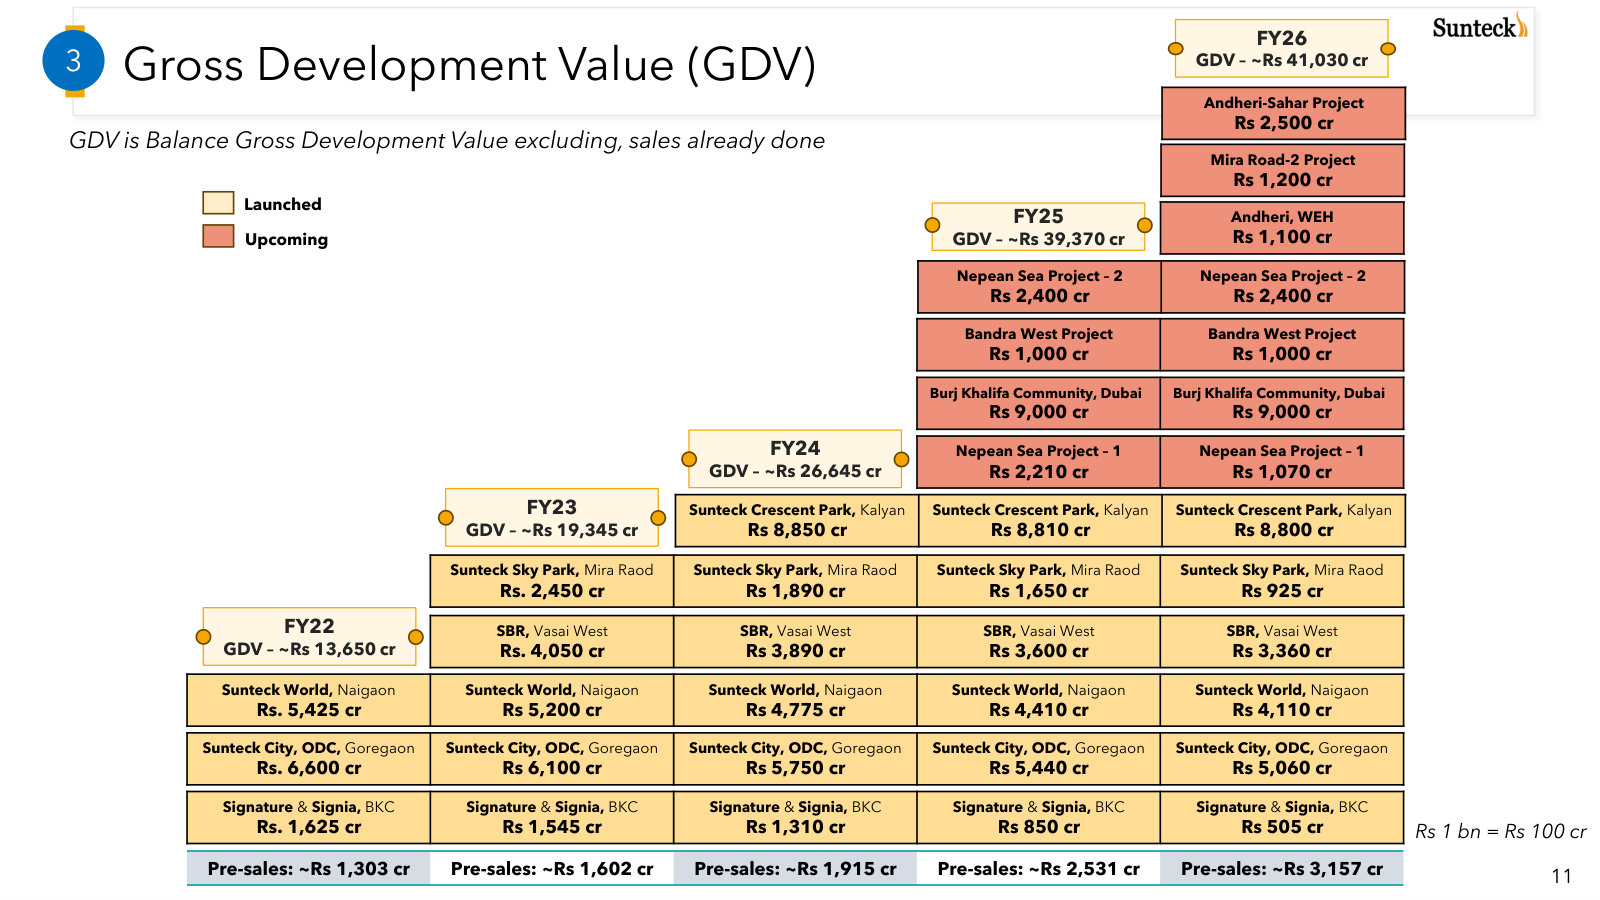
| Balance gross development value | — | 18,018 | 23,524 | 31,947 | 46,063 |
| Total development acquisitions (MSF+) | — | — | — | — | 50 |
| Projects successfully delivered | — | — | — | — | 19 |
| Uber Luxury share of GDV | — | — | — | — | 39.0% |
| Premium Luxury share of GDV | — | — | — | — | 27.0% |
| Aspirational Luxury share of GDV | — | — | — | — | 34.0% |
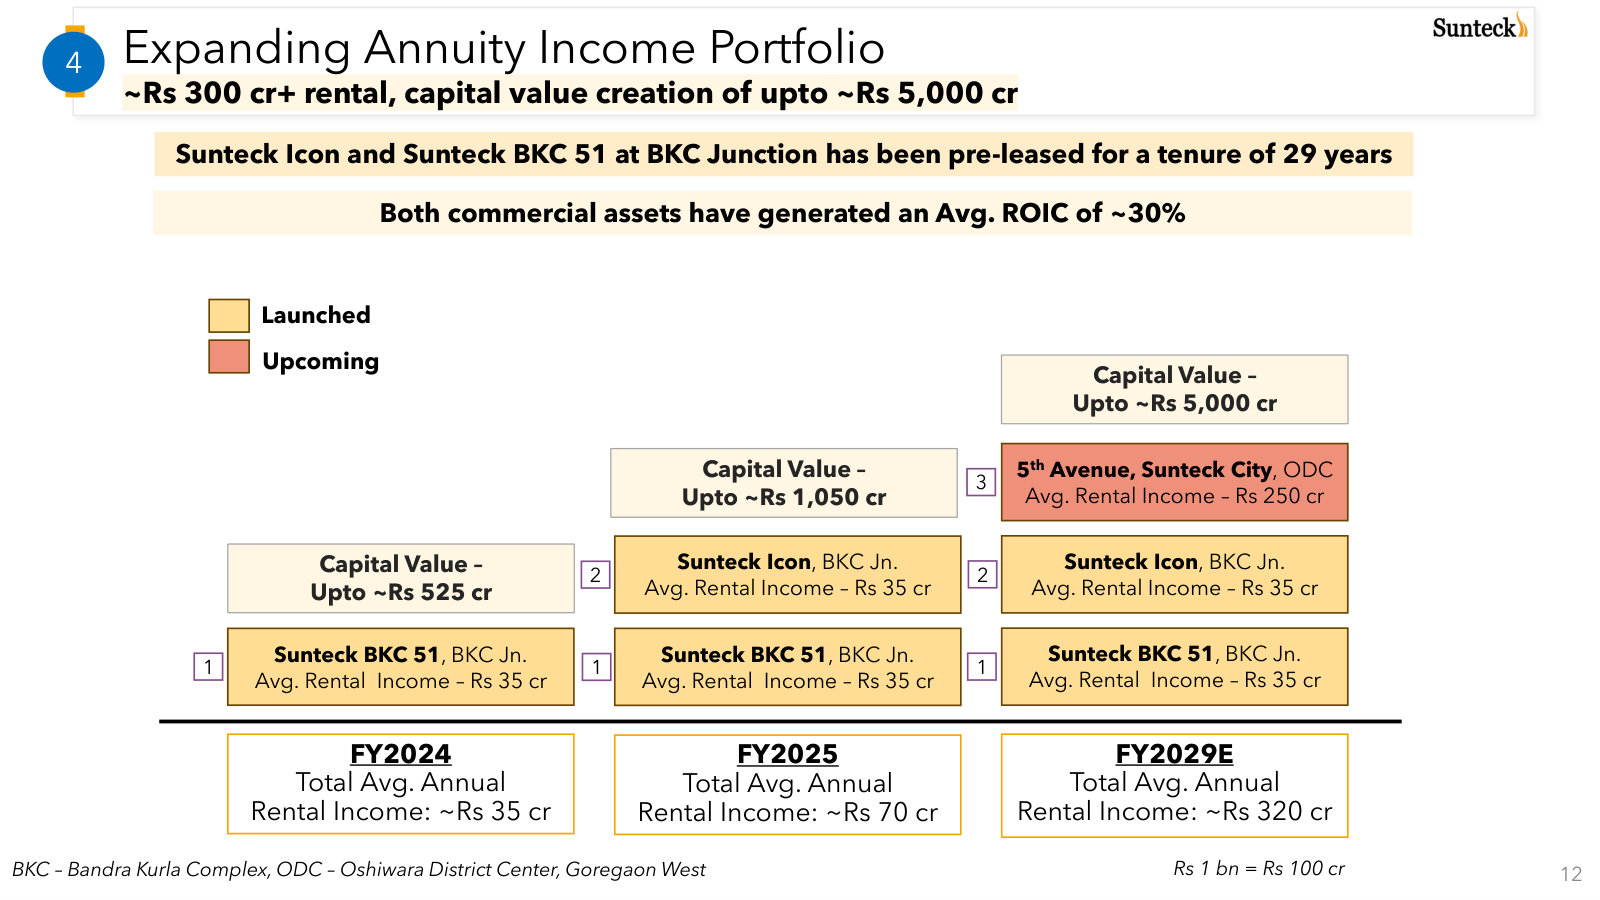
| Total average annual rental income | — | — | — | 42 | 82 |
| Commercial assets average ROIC | — | — | — | — | 30.0% |
Source: company filings [20] [21] [22] [23]. Click any linked figure to open the filing page with the row highlighted.
Net Debt to Equity
| Net Debt to Equity | FY2021 | FY2022 | FY2023 | FY2024 | FY2025 |
|---|---|---|---|---|---|
| Loans to JDA partners | — | 84 | 188 | 237 | 303 |
| Net debt | — | 711 | 340 | (10) | (146) |
| Net debt / equity | 0.2 | 0.2 | 0.1 | 0.0 | (0.0) |
| Quasi-equity and others | — | 115 | 113 | 95 | 60 |
| Adjusted net debt | — | 828 | 454 | 86 | (87) |
| Adjusted net debt / equity | — | 0.2 | 0.1 | 0.0 | (0.0) |
Source: company filings [24]. Click any linked figure to open the filing page with the row highlighted.
Long-Term Record
| Fiscal year | Revenue from operations | Profit before tax | Net profit for the year | Diluted (in ₹) | Net cash generated from operating activities - [A] | Purchase of property, plant and equipment, investment properties and intangible assets | Total equity |
|---|---|---|---|---|---|---|---|
| FY2019 | 1,238.92 | 534.01 | 348.67 | 0.23 | — | — | 4,019.29 |
| FY2020 | 739.95 | 136.09 | 98.97 | 0.07 | (103.07) | (21.46) | 3,633.81 |
| FY2021 | 838.54 | 79.73 | 57.29 | 0.04 | 390.88 | (22.48) | 3,786.89 |
| FY2022 | 677.26 | 42.96 | 33.11 | 0.02 | (40.83) | (24.11) | 3,683.33 |
| FY2023 | 440.74 | 5.45 | 1.71 | 0.00 | 318.65 | (22.03) | 3,390.03 |
| FY2024 | 677.25 | 113.87 | 85.04 | 0.06 | 130.68 | (75.72) | 3,745.91 |
| FY2025 | 998.17 | 214.65 | 175.87 | 0.12 | 222.11 | (38.05) | 3,814.24 |
Source: consolidated statements across filings; older years from the standardized feed [14] [1] [9] [16]. Click any linked figure to open the filing page with the row highlighted.
Traceability
325 of 361 figures on this page (90%) link to the filing page containing the native reported figure from which the USD value was converted — click a linked figure to open that source row. Unlinked figures come from standardized data feeds or pre-filing years.
FY2021–FY2025 main-statement values use each fiscal year's own consolidated annual report; FY2020 long-term values use the explicitly restated comparative column in the FY2021 annual report.
FY2019 income-statement values are standardized provider data and are unlinked; FY2019 total equity uses the restated 1 April 2019 balance printed in the FY2021 annual report.
Sunteck reports one operating segment—Real Estate/Real Estate Development and Related Activities—so the revenue mix uses the filing's revenue-from-operations disaggregation rather than an invented segment split.
The FY2024 revenue-note components total ₹56,494.28 lakhs, ₹9.60 lakhs above the printed ₹56,484.68 lakh total; all filed figures are preserved and the total-row check intentionally exposes the variance.
The indexed quarterly investor presentations contain rounded ₹ crore P L summaries but no full quarterly cash-flow statements; no quarterly block is emitted because those rounded summaries cannot be mixed with the annual report's ₹ lakh display scale without converting cited values.
17 figure(s) differed between the data feed and the filing; the filing value is shown (see the run's metrics/metrics_tab.json for the audit trail).
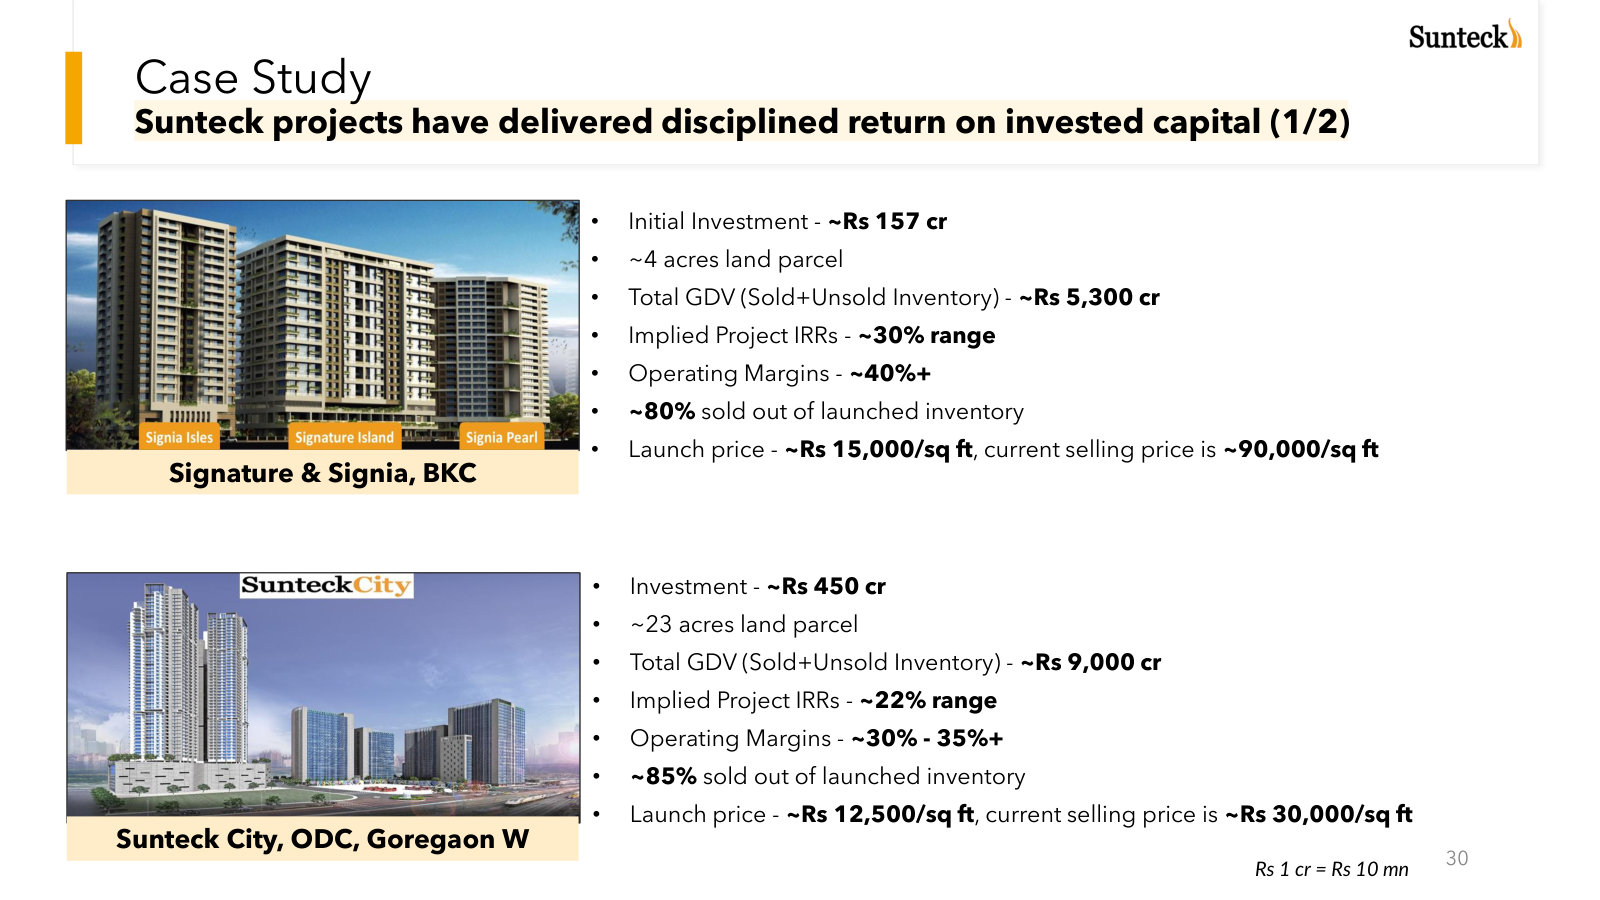
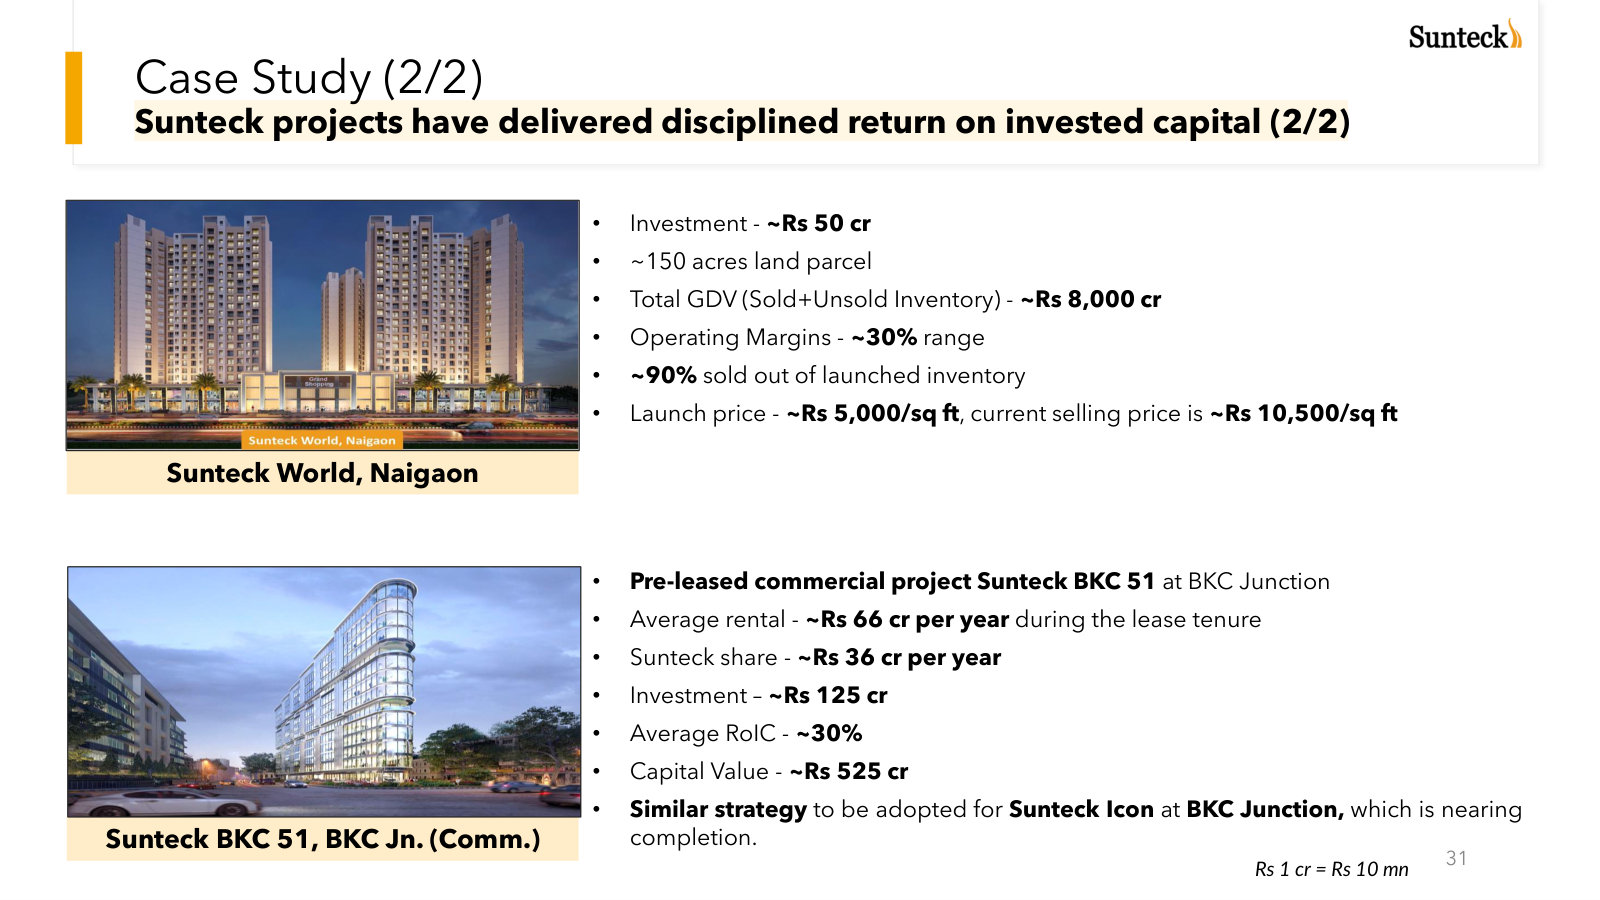
Sunteck Realty Limited's management explains the business in its own materials. The slides below do the most of that work, pulled from the documents preserved in Sources. Each source link opens the complete presentation at that slide in a new tab.
Q4 & Full Year FY26 Investor Presentation — FY2026
The latest full-year deck maps the portfolio, pipeline, operating cash flow and capital structure. · Open the full document →
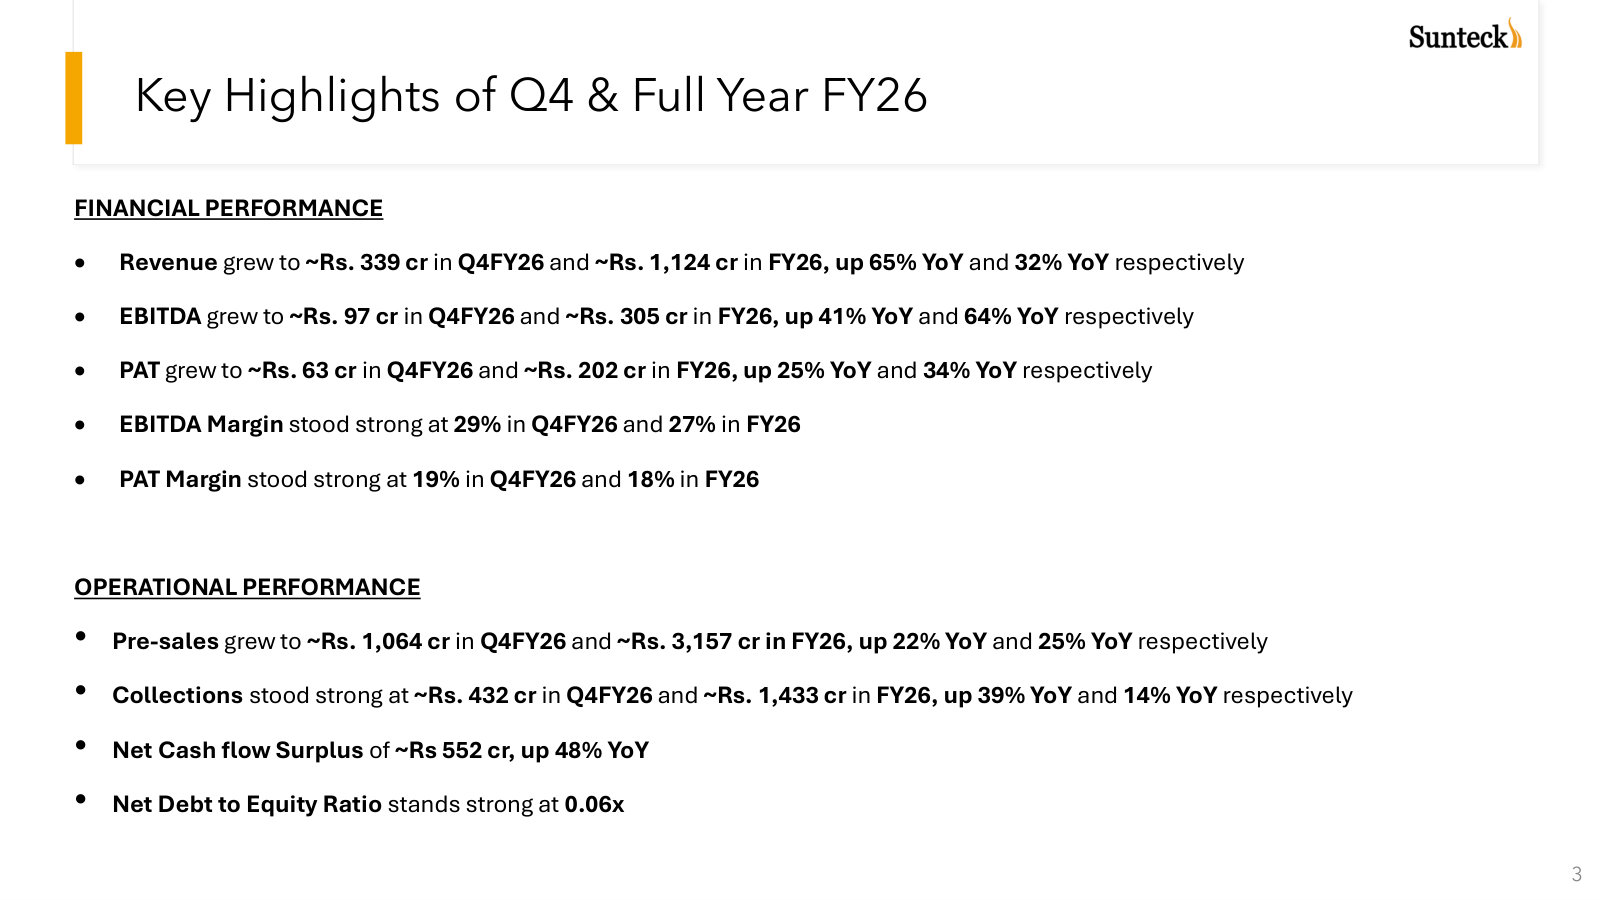
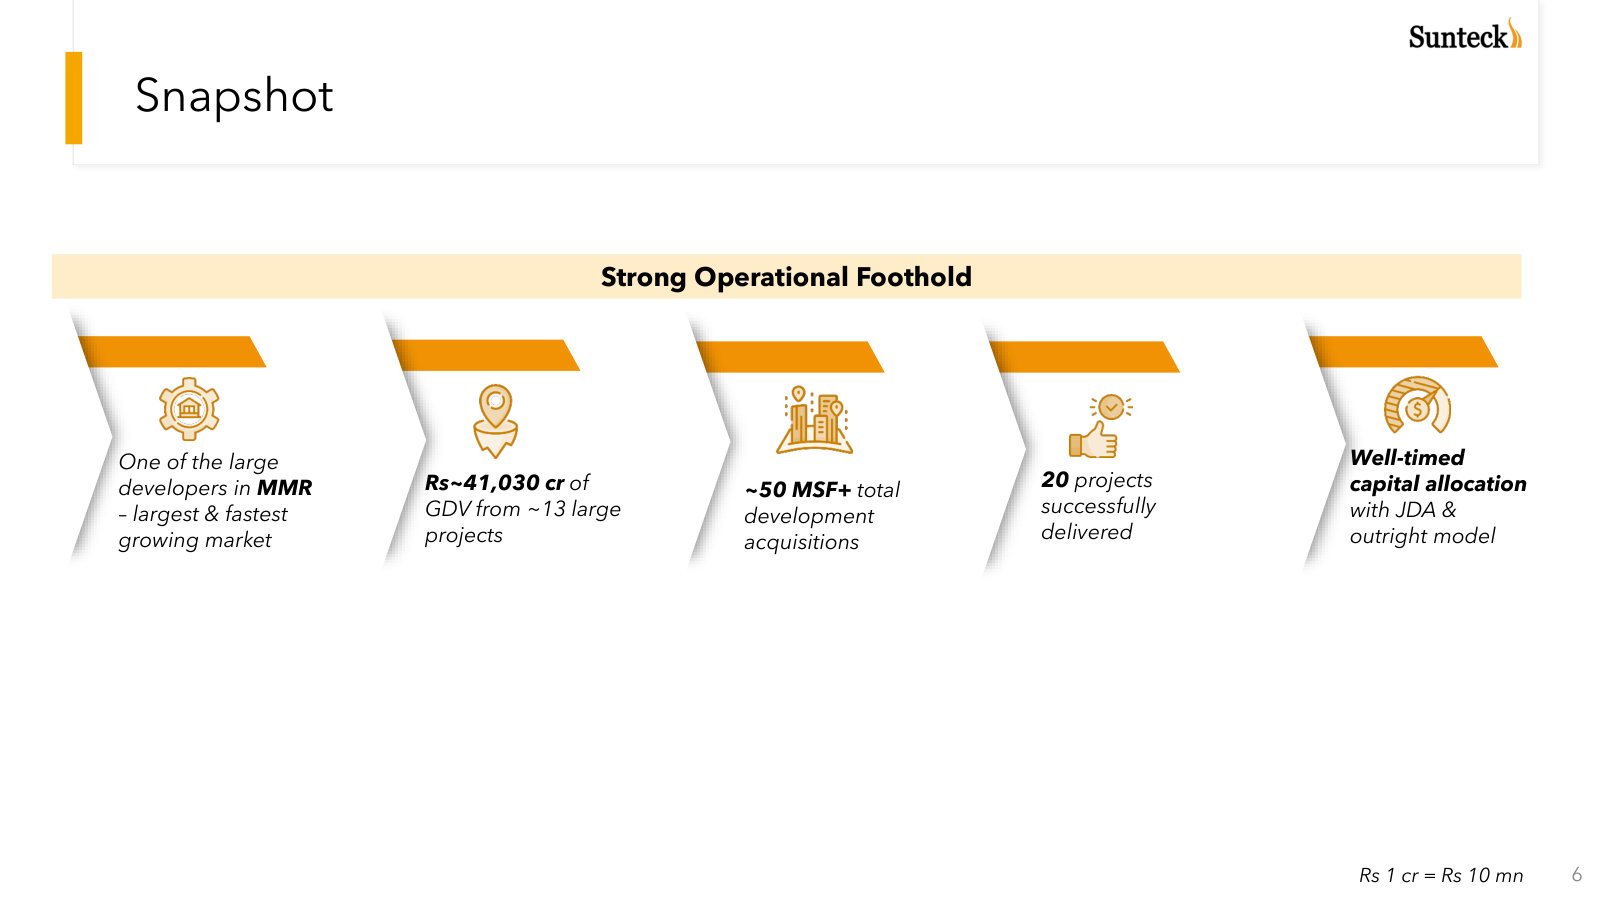
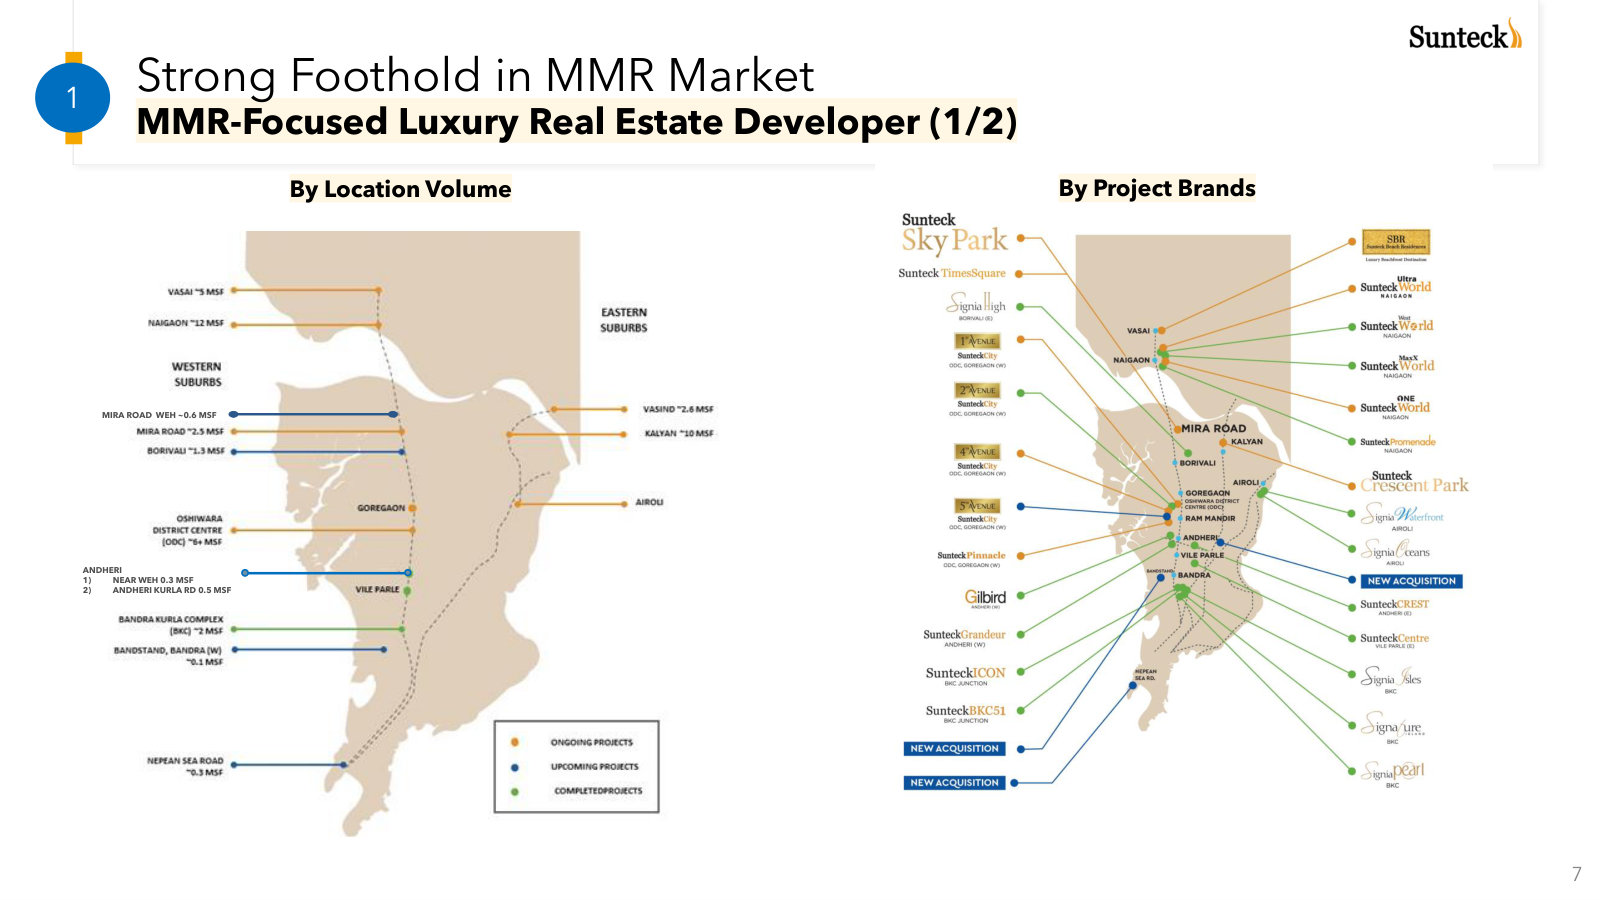
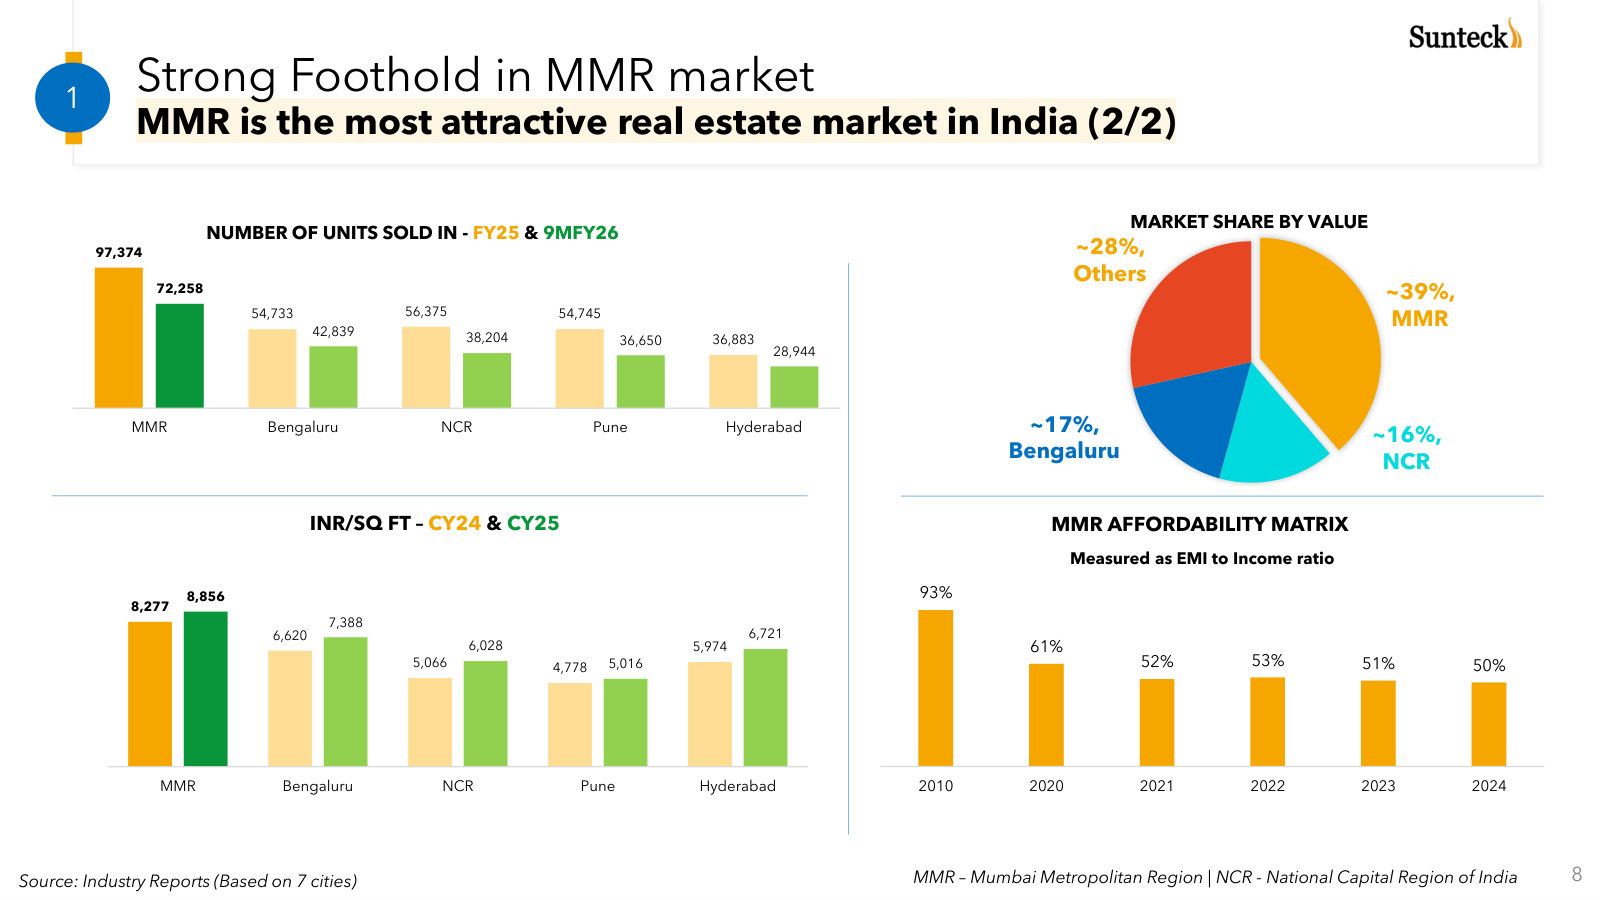
Q1 FY25 Investor Presentation — Q1 FY2025
The only deck that sets out the economics and market rationale for Sunteck's Dubai project. · Open the full document →
Q2 & H1 FY24 Investor Presentation — H1 FY2024
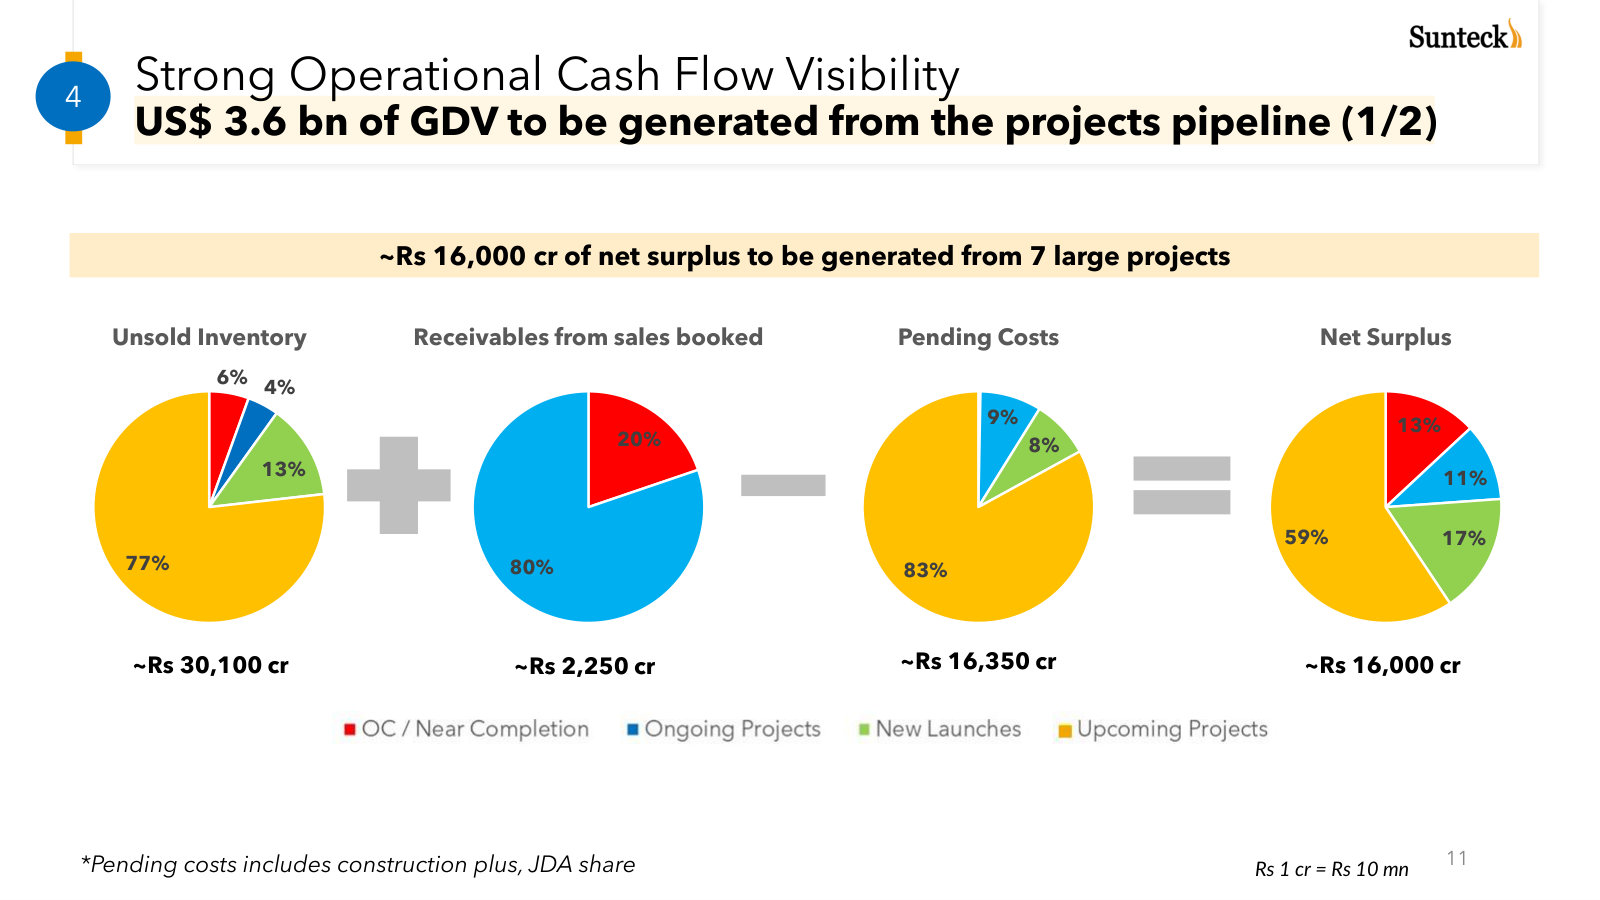
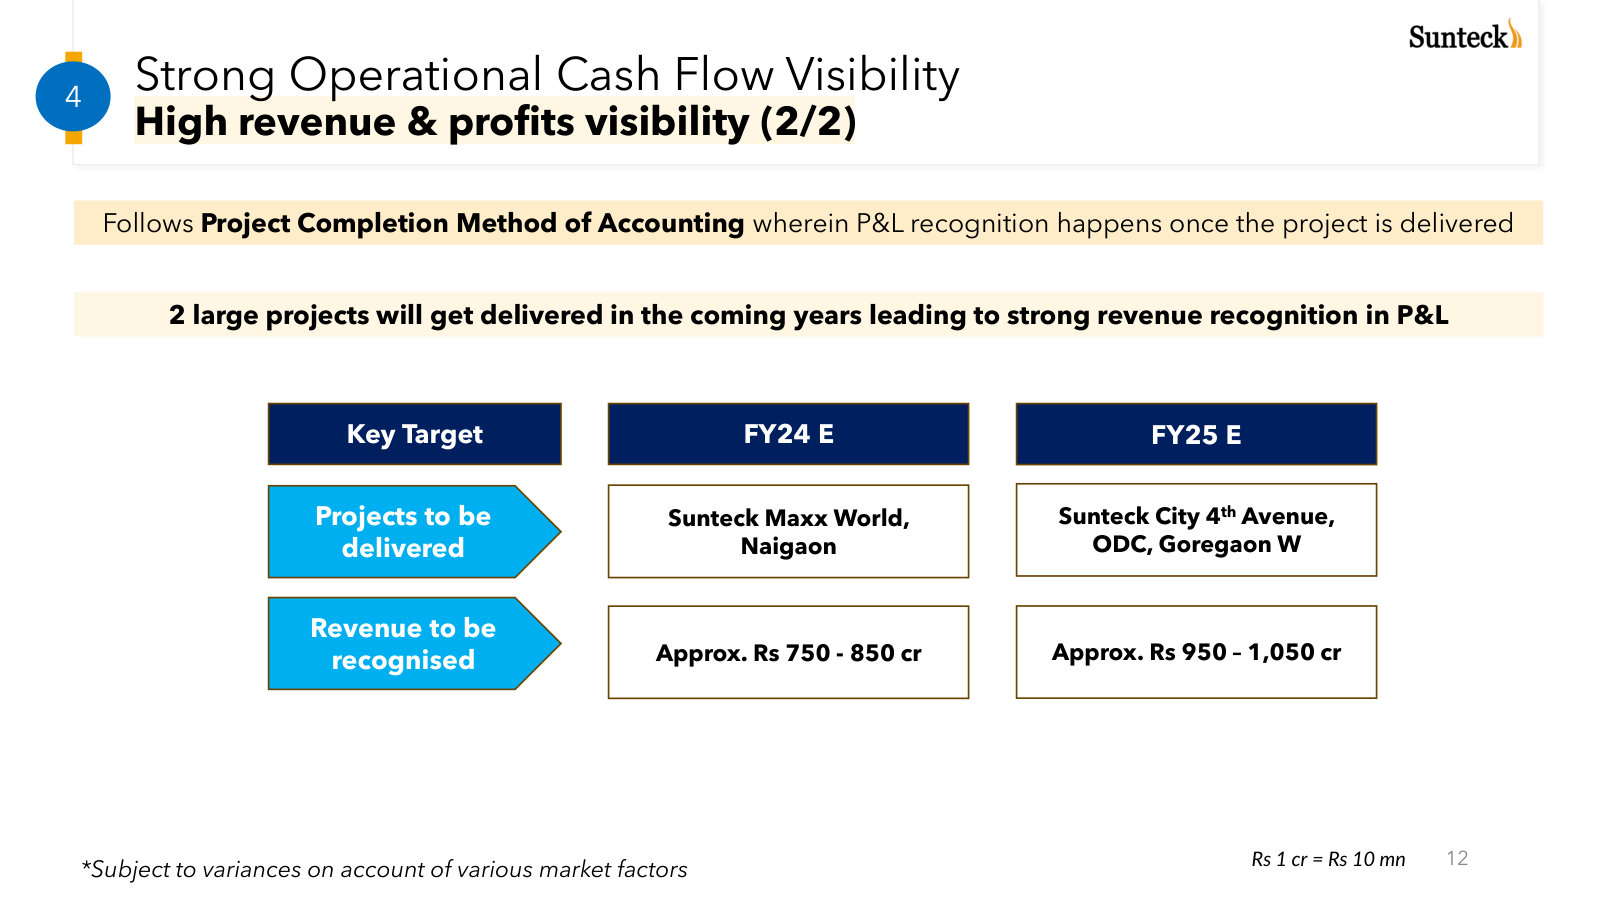
An older but unusually detailed deck on pipeline cash, revenue recognition and project-level returns. · Open the full document →
More from management
Q1 FY24 Investor Presentation — Q1 FY2024 · 23 pages · Management's earlier seven-growth-engine and intrinsic-value framework, before the Dubai expansion. · Open →
Sunteck Realty Limited's management answers for the business every quarter. These are the exchanges that explain it best — verbatim, from the call transcripts preserved in Sources. Each link opens the full transcript at that page in a new tab.
Q1 FY2025 Earnings Call — Q1 FY2025
The original Dubai economics, plus the most useful challenges to cash flow and multi-year growth guidance. · Open the full transcript →
The first detailed Dubai unit economics: initial equity, build cost and reliance on presales.
Puneet Gulati (HSBC); Kamal Khetan (Chairman and Managing Director): Puneet Gulati: Thank you so much and congratulations on good pre-sales momentum and also on the new project. Can you help me understand the broad economics of the Dubai project? How much would it cost you to build? And how would the money flow in from India to Dubai and back from Dubai to India? Is there any tax implication we will need to be ready with? Thank you.
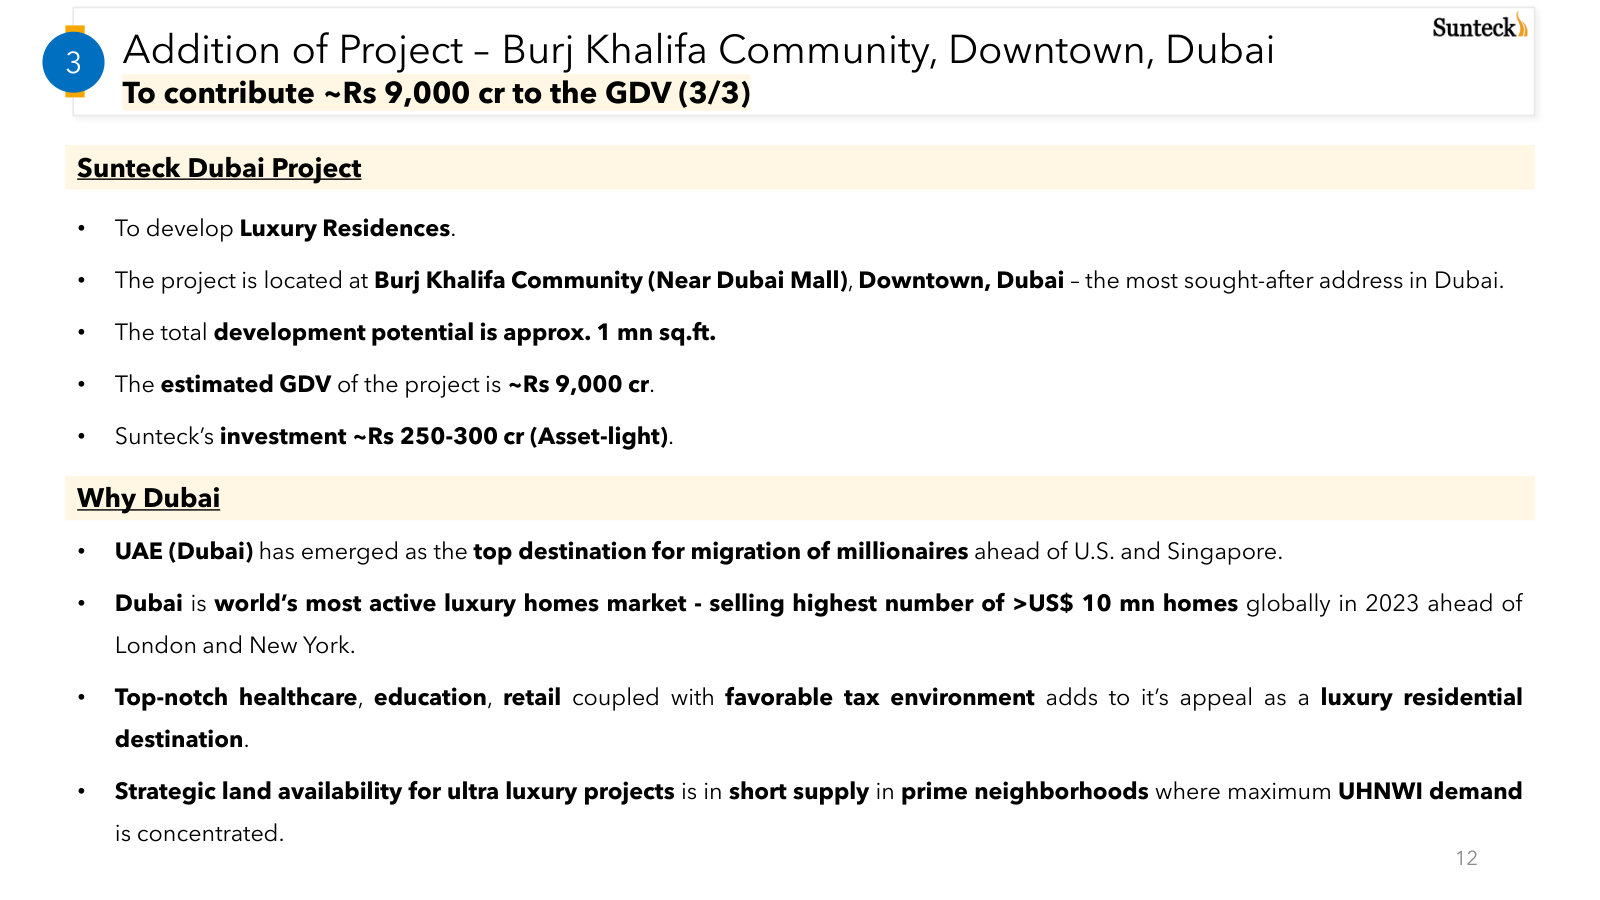
Kamal Khetan: So, this project is in 100% subsidiary of Sunteck. We have invested close to approximately just Rs. 250 crores, so it is a quite asset-light model. And the project is obviously, I have said in my opening remarks, is in the heart of Downtown in the Burj Khalifa community near Dubai Mall. And so, most of the money obviously will come from the pre-sale. Just for maybe a little bit more investment in the beginning, and no incremental investments we are looking at them, very clear. Some small money for the launches and all which may be required, which may go from India, which will be negligible with respect to the size of the project. And cost, obviously, the cost of the project is around Rs. 2,000 crores. And which should, most of it should come from the pre-sales. And we all know the Dubai market is doing extremely crazy well, on the launches the projects are getting sold almost to the 100%, tune of. And being this project in the heart of the, once again at the cost of repetition, heart of the Downtown, next to Dubai Mall, we do not see any problem there.
Puneet Gulati: So Rs. 9,000 crores GDV, Rs. 2,000 crores construction cost. And from that, we should look at your share at 50%.
Kamal Khetan: Yes.
p. 4 · Read in context →
Existing multi-year projects fund near-term growth; Dubai and Nepean Sea were framed as upside, not necessities.
Sarang Gupta (Briarwood Capital); Kamal Khetan (Chairman and Managing Director): Sarang Gupta: Basically, you are saying in FY '25 you get 30%, 35% growth from your existing portfolio, just launching new inventories there. And then next year you will have the impact of launch of Burj Khalifa and Nepean Sea Road which is Rs. 9,000 crores of total GDV. And so, then that will help you continue this growth into the next two years essentially?
Kamal Khetan: Yes. I think that growth will be, in fact, ideally it should be more than that. And plus there is many more projects of which already acquisition has been done but it has not been added to the GDV value. So, to give you one more example, let's say, Borivali, ESKAY Resorts, which is also there. Plus there is a Bandstand which is there, plus there are few more projects which we are contemplating, which I do not want to disclose before we complete the transaction, three-four projects which are sizable projects and which we would like to, as soon as we close those transactions, we would like to disclose it to the market.
Sarang Gupta: And maybe just last question from my side is how, both Dubai and Nepean Sea kind of large projects in terms of year one pre-sales, you think when we launch them in FY '26, that will be a big boost to your annual sales? Like how do you think about sales expectations at Dubai?
Kamal Khetan: So, we want to be conservative when we are giving our guidance which we have maintained at 30%, 35%. We all know if, obviously, the launches in Nepean Sea Road and Dubai looking at the current status of the market. Obviously, we may achieve much more than 30%, 35%. But we do not want to over-commit and then under-deliver. We are very clear on that.
p. 8 · Read in context →
Q4 and FY2023 Earnings Call — Q4 FY2023
The clearest explanation of Sunteck's large-project growth engines, segment ladder and commercial monetization choices. · Open the full transcript →
Why commercial assets became a second engine alongside residential development.
Kamal Khetan (Chairman and Managing Director): Along with residential, we are also now focusing on building a rental portfolio from our commercial projects and to mention we have already pre-leased the entire project of Sunteck BKC51 at BKC Junction for lease tenure of 29 years. Similarly, we are looking to prelease our second project also at BKC Junction, namely Sunteck Icon.
p. 4 · Read in context →
Q4 and FY2022 Earnings Call — Q4 FY2022
The essential bridge from project cash economics to reported earnings, plus funding, segmentation and competition. · Open the full transcript →
The portfolio is deliberately branded across uber-luxury, mid-income and affordable segments.
Biplab Debbarma (Antique Stock Broking); Kamal Khetan (Chairman and Managing Director): Biplab Debbarma: You have mentioned about FY23 adding 23 million square feet in acquisition. You are still actively looking for acquisition. Just wondering if you can give some insights, like if I see barring one project in Borivali, I believe all the projects are in the peripherals above. We can say affordable space maybe, not Vasai. Vasai is not kind of affordable still. It is in the peripheral suburb and outskirts. So, is it a conscious strategy? I'm just trying to understand or is it just opportunistic? You can do even in a premium or this is a part of your strategy 3.0 that you would be mainly looking into affordable in mid-income.
Kamal Khetan: No, not at all. In fact, that's the reason we have created a brand across the spectrum. Separate branding for high income, uber luxury and separate branding for mid-income, separate branding for affordable. So, we are very clear and conscious that across all the segments we have to grow and we continue to. As you see, we have added one Nepean Sea Road project last year to last year, I believe in the uber luxury segment and we continuously scout for more projects. That' not that's the only project we have acquired. We are scouting for it and we are confident we will be at doing some new announcement very soon. Same as mid-income you saw that we did SK Resorts at Borivali; I think Vasai which is on the beach front is again in the mid-income segment. So, we are going in mid-income as well. So, again affordable obviously we have done lot you know that and obviously we got some good opportunities, so we didn't want it to, it is what so tempting. We didn't want it to miss these opportunities.
p. 7 · Read in context →
More calls
Q3 and 9M FY2026 Earnings Call — Q3 FY2026 · 12 pages · Go here for the pre-war Dubai launch plan and the economics of FY2026's three-project acquisition push. · Open →
Q2 and H1 FY2026 Earnings Call — Q2 FY2026 · 9 pages · The clearest midyear account of accelerating business-development spend while holding leverage near zero. · Open →
Q1 FY2026 Earnings Call — Q1 FY2026 · 7 pages · Useful for the FY2026 launch slate and why collections were expected to trail new-launch presales temporarily. · Open →
Q4 and FY2025 Earnings Call — Q4 FY2025 · 7 pages · Shows the first full-year impact of the luxury mix shift and management's preference for velocity over price hikes. · Open →
Q3 and 9M FY2025 Earnings Call — Q3 FY2025 · 9 pages · The place to see Nepean Sea Road enter presales and the second parcel lift the project's disclosed GDV. · Open →
Q4 and FY2024 Earnings Call — Q4 FY2024 · 10 pages · Management explains how surplus cash would be split between high-return acquisitions and commercial annuity assets. · Open →
Q3 FY2024 Earnings Call — Q3 FY2024 · 12 pages · The clearest early framing of the annuity-income buildout at BKC and Oshiwara alongside GDV expansion. · Open →
Q3 and 9M FY2023 Earnings Call — Q3 FY2023 · 10 pages · Worth reading for launch-approval risk and the landlord-loan mechanism used to fund project approvals. · Open →
Sunteck Realty Limited's annual reports contain management's most considered account of the business. These are the sections, passages and visual pages worth opening in the originals preserved in Sources.
Sunteck Realty Limited — FY2025 Annual Report — FY2025
The latest full account of Sunteck’s luxury-led portfolio, operating model, FY2025 performance and project-level risks. · Open the full document →
About Us — p. 40 · Read the full section →
Defines the portfolio’s scale, city focus and five luxury price tiers in two short paragraphs.
Portfolio scale and positioning across luxury tiers.
Sunteck focusses on a city-centric development portfolio of over 50 million sq. ft. spread across 32 projects.
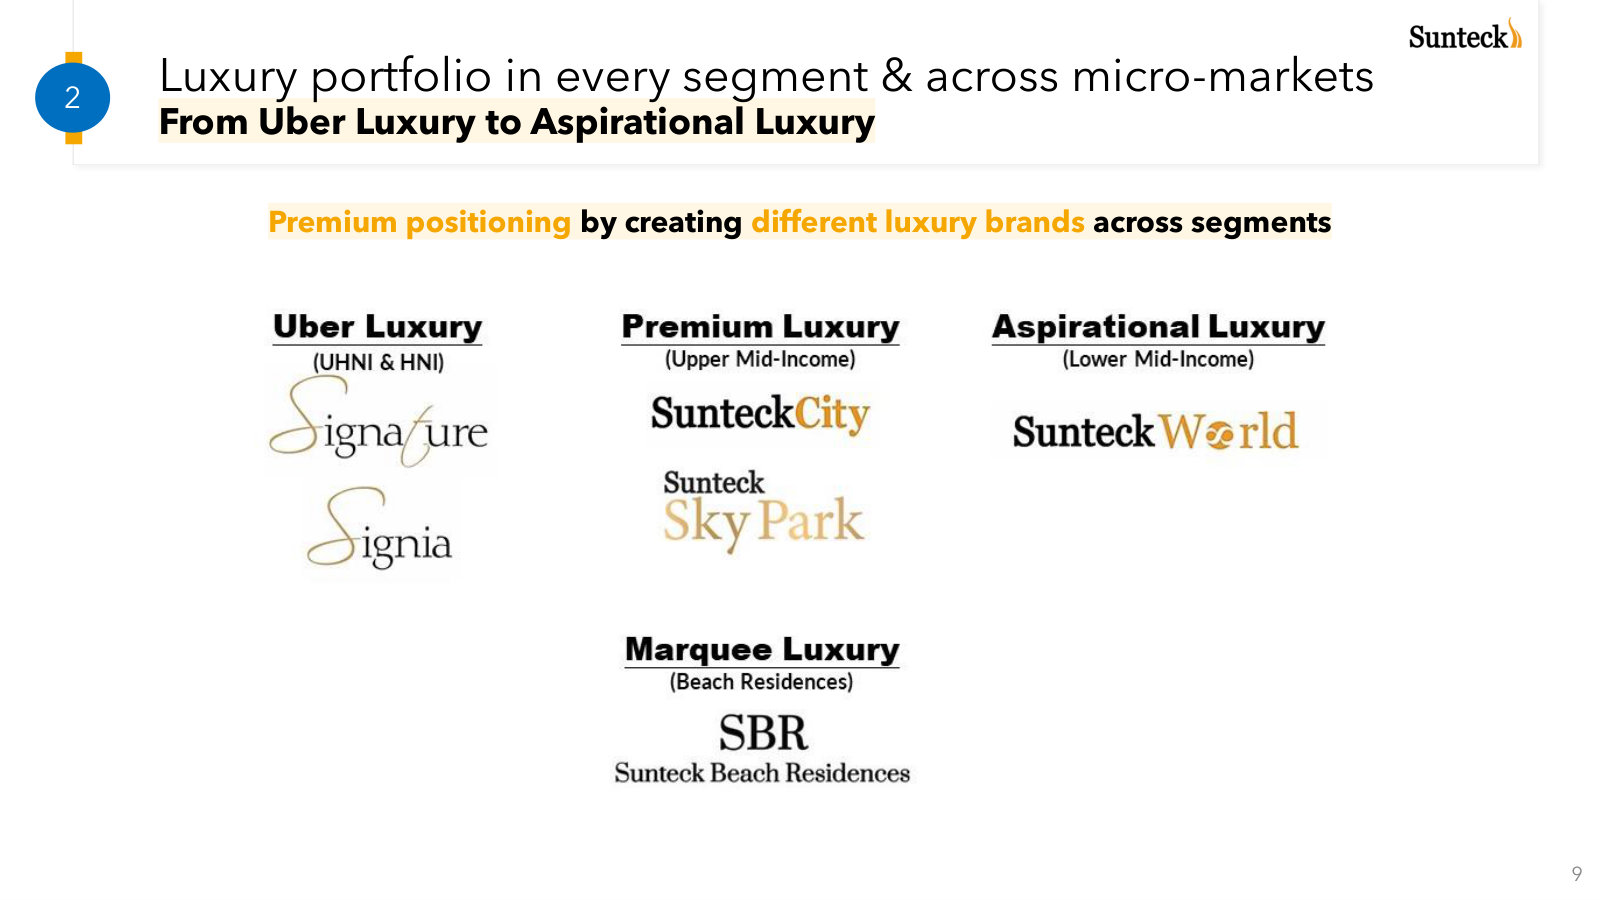
Sunteck’s presence across the spectrum is differentiated by Uber Luxury, Ultra Luxury, Premium Luxury, Marquee Luxury & Aspirational Luxury segments.
p. 40 · Read in context →
CMD’s Message — p. 42 · Read the full section →
Connects FY2025’s record presales to MMR concentration, Dubai expansion and the rental-income base.
The geographic and product-market engines behind management’s growth plan.
A key tenet of Sunteck’s strategic approach is concentrated market presence. Our focused strategy — built around deep penetration of the Mumbai Metropolitan Region (MMR) — continues to deliver substantial measurable advantage. From ultra-luxury developments in BKC, South Mumbai, and Bandra, to premium luxury projects in growth corridors like Oshiwara District Centre – Goregaon West, Mira Road & Vasai West and aspirational luxury projects in Naigaon and Kalyan, our portfolio caters to a wide spectrum of customer demand. FY2025 marked a transformative year for Sunteck Realty, with the strategic activation of our Dubai, project investment in the prestigious Dubai Downtown, Burj Khalifa community near Dubai Mall. This complemented by our marquee upcoming projects in Nepean Sea Road, South Mumbai positions us with powerful growth engines driving sustained value creation as well as geographical diversification in the uber-luxury segment.
p. 43 · Read in context →
Long leases at two commercial properties supply a recurring-income counterweight.
We have strengthened our annuity income portfolio through two premium commercial properties — Sunteck Icon and Sunteck BKC51. This portfolio contributes approximately \`70 crores in annual rental income, consistently enhancing our revenue stream and reinforcing our leadership in the commercial real estate segment. The steady annuity income provides stable cash flows, supports long-term financial stability, and creates a robust foundation for future growth in our investment portfolio.
p. 43 · Read in context →
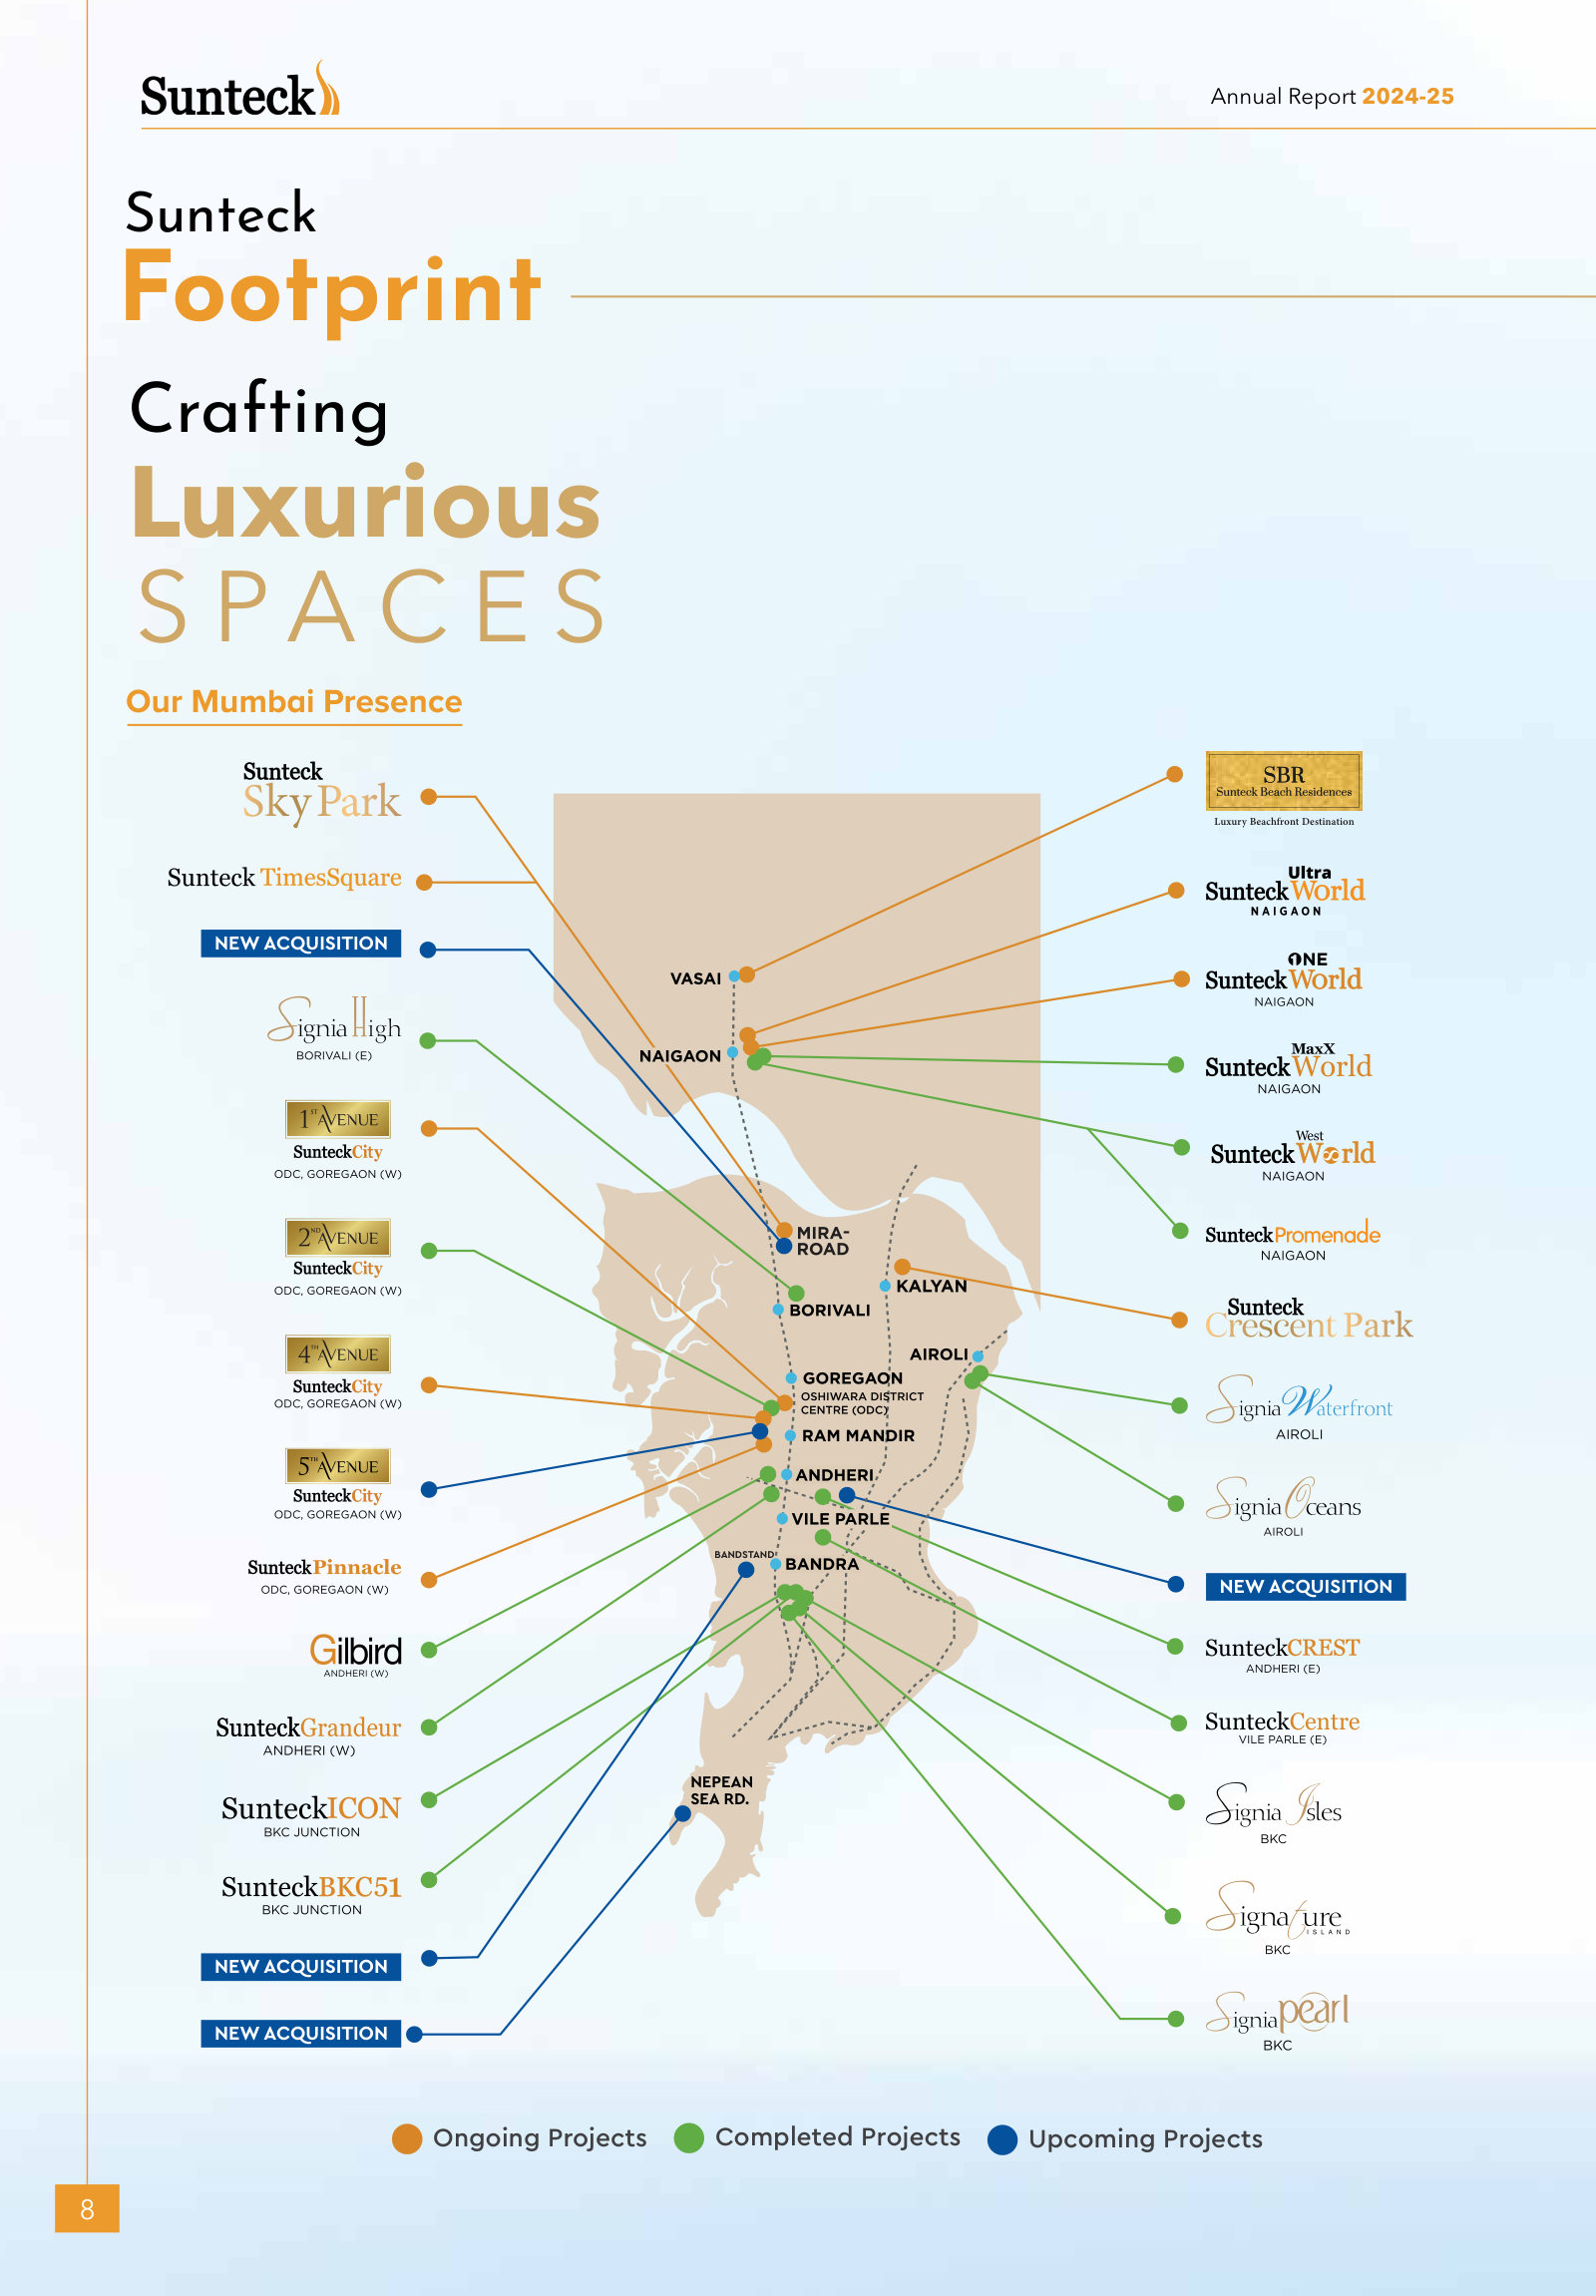
Sunteck Footprint — p. 46 · Read the full section →
Maps completed, ongoing and upcoming projects across MMR more clearly than the surrounding project profiles.
Business Overview — p. 175 · Read the full section →
The clearest explanation of project sourcing, margin hurdles, in-house construction and balance-sheet discipline.
How Sunteck sources projects and controls margin, construction quality and execution.
Sunteck Realty remains steadfast in its commitment to best product delivery which continue to be at the core of its business philosophy. Over the past years, the company has strategically shifted its portfolio towards the ultrapremium Uber Luxury segment, reflecting its aspiration to establish a leadership position in the luxury real estate market. Its business development strategy is diversified and flexible, encompassing redevelopment projects, strategic land acquisitions, and combination of an asset-light model. However, every opportunity is carefully evaluated against stringent margin thresholds to ensure financial discipline. The company applies segment-specific risk-return priorities to maintain profitability across all categories. Construction for Sunteck Realty’s projects is predominantly managed inhouse, enabling the company to exercise rigorous oversight and maintain stringent quality standards throughout the building process. By leveraging its internal construction teams, Sunteck ensures close coordination across all phases of quality control resulting in superior craftsmanship and timely delivery. This hands-on approach not only allows for greater control over cost efficiencies and timelines but also helps uphold the brand’s commitment to excellence and customer satisfaction. The in-house model fosters seamless communication among project managers, engineers, and quality inspectors, minimizing risks associated with third-party contractors and ensuring that every detail aligns with the company’s exacting standards.
p. 175 · Read in context →
The commercial portfolio’s tenant concentration, lease length and escalation structure.
Your company has forayed into commercial portfolio which currently comprises of two high-quality assets, marking its strategic positioning into annuity income streams. Both properties – Sunteck BKC51 and Sunteck Icon are leased to single tenants on long-term contracts spanning 29 years, ensuring full occupancy and stable, predictable cash flows. The leases include built-in escalation clauses, guaranteeing rental increases each year and enhancing income growth over time. This focused approach delivers very high returns on capital employed, reinforcing Sunteck’s commitment to building a robust and resilient commercial asset base that complements its residential business while providing consistent, long-term financial stability.
p. 175 · Read in context →
Consolidated Financial Performance — p. 180 · Read the full section →
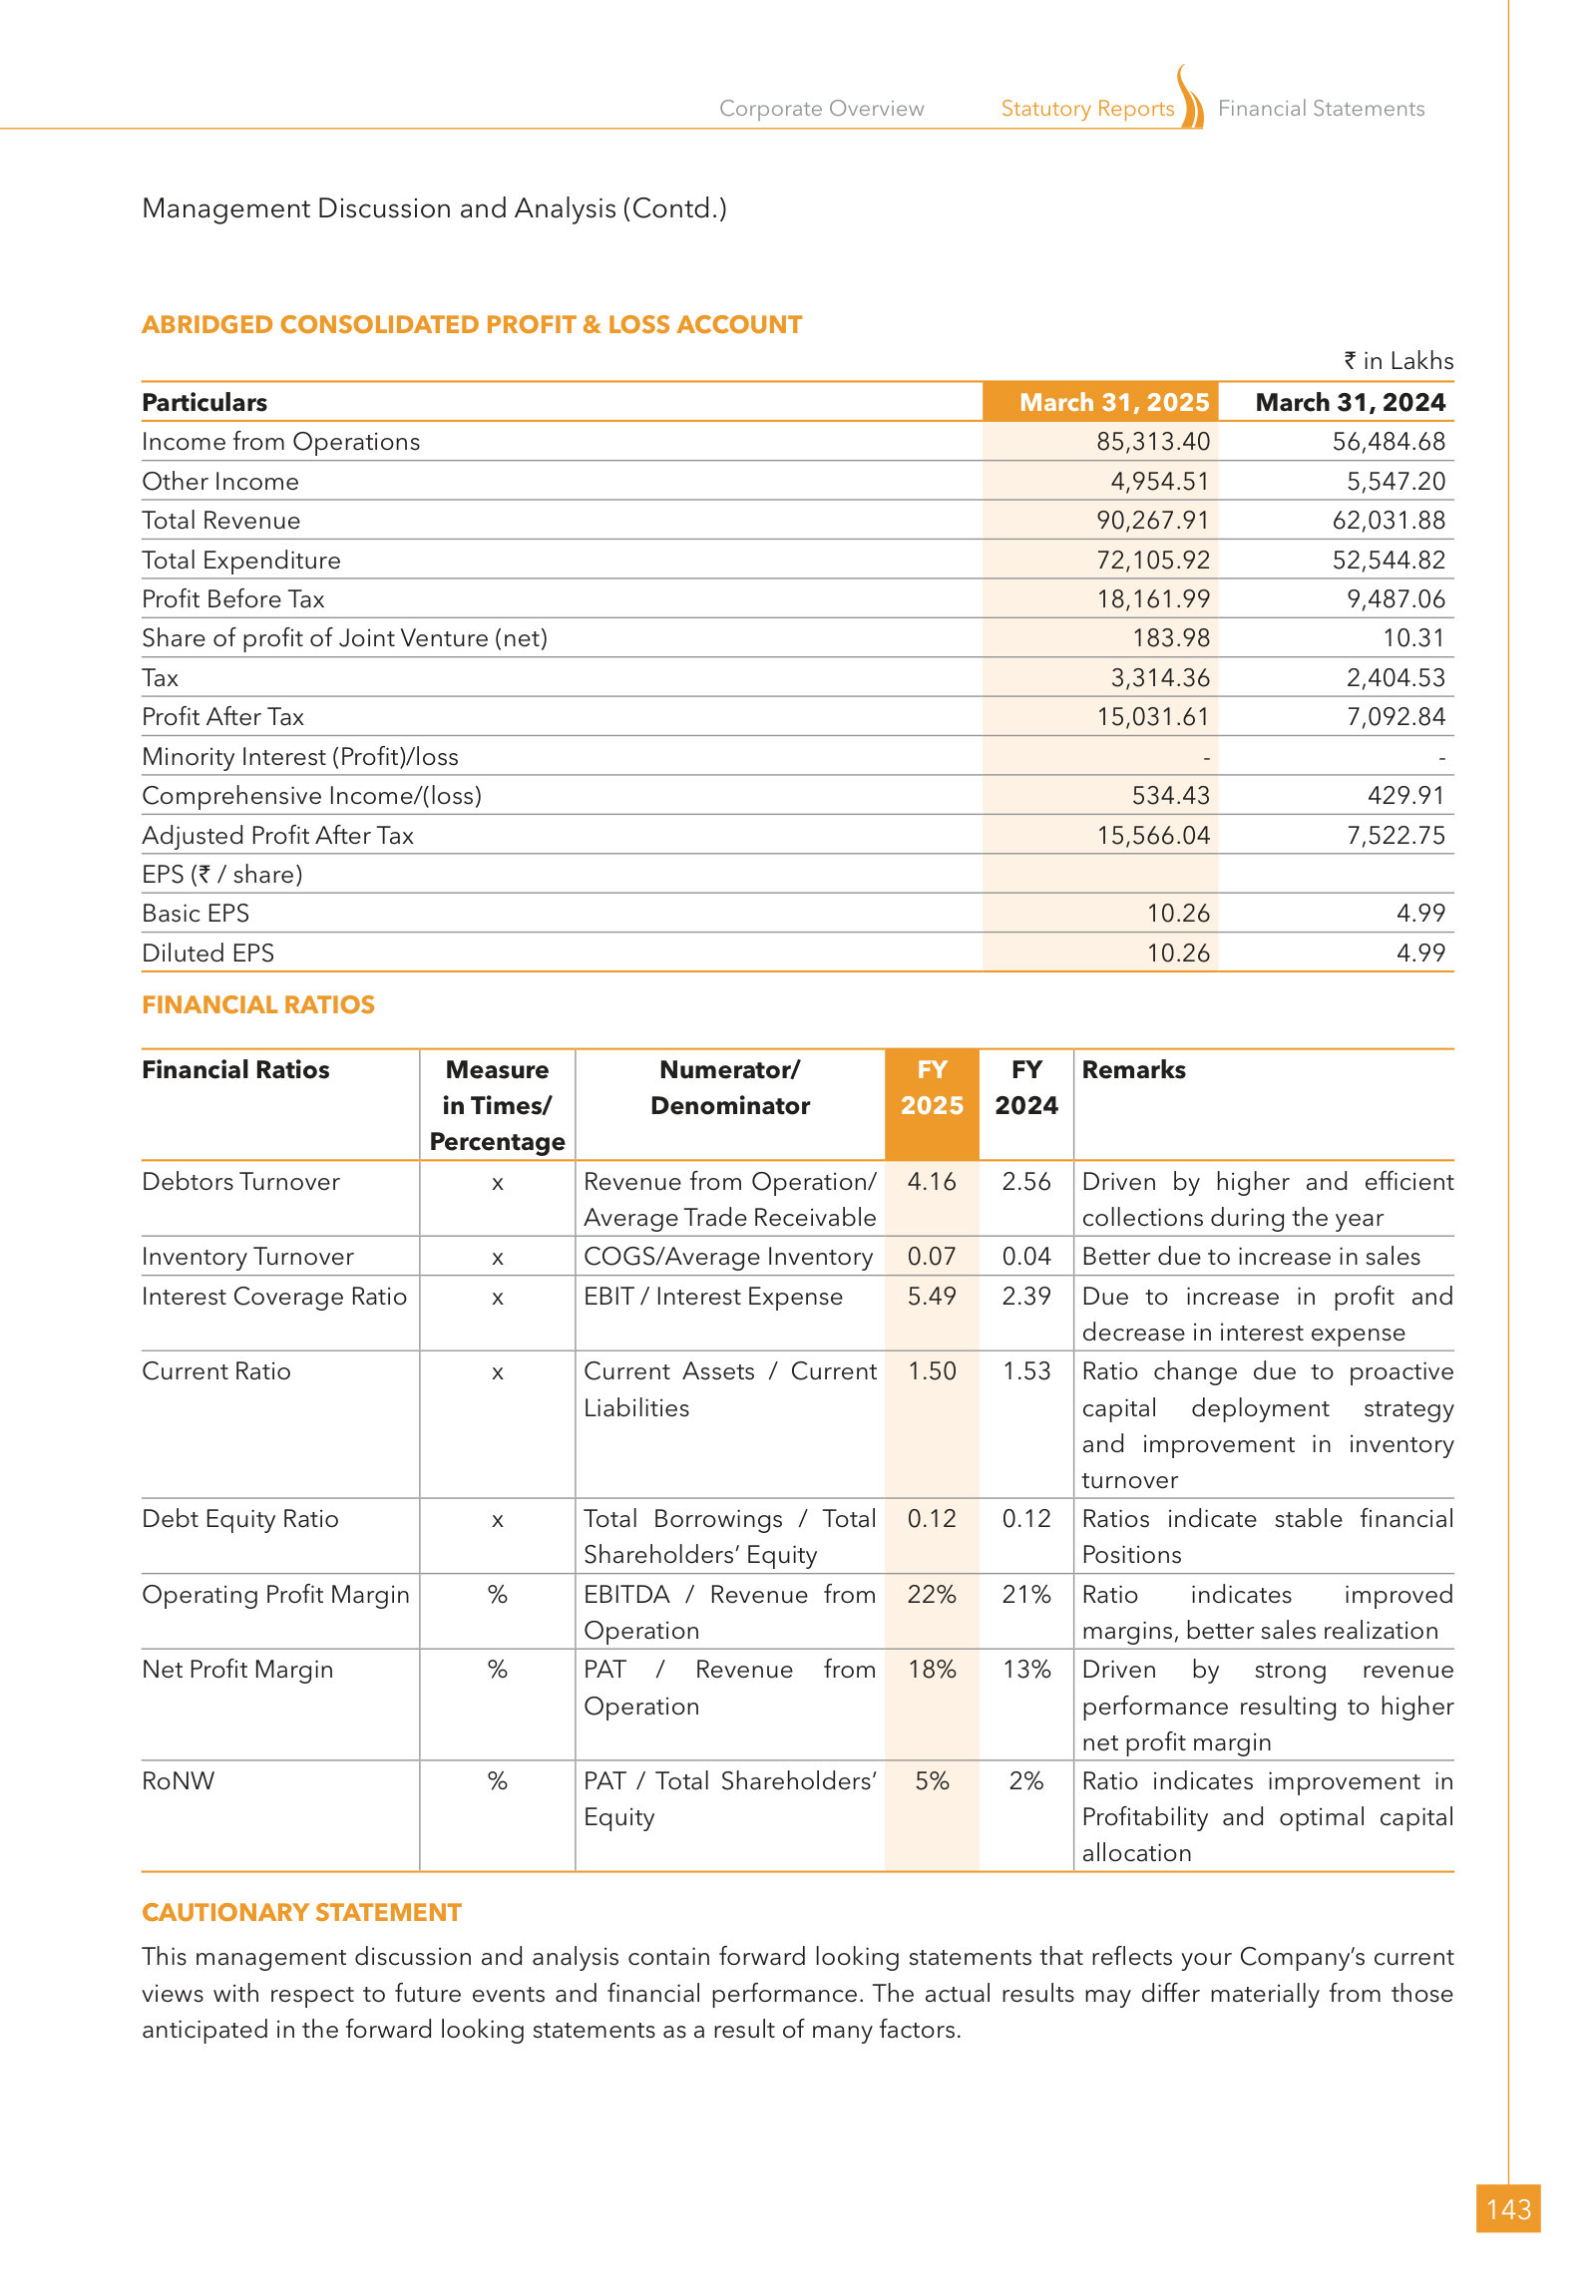
Pairs management’s FY2025 summary with the year-on-year P&L and ratios that show where performance changed.
Management’s compact summary of revenue, profit, net worth and leverage.
Your Company recorded Income from operations of \
85,313.40 Lakh in 2024-25. PAT stood at \\15,031.61 Lakh in 2024-25. As part of the Company’s endeavour to reward shareholders, the Board has recommended a final dividend @150% of \1.5 per equity share having face value of Re. 1 each to the Shareholders of the Company. The Company’s proposed dividend payout in FY 2024-25 shall be approx. \\21.97 Crore on the total equity base. As on 31st March, 2025, the Net Worth of the Company stood at \` 3,260 Crore. Net Debt to equity ratio stood at -0.04x in FY 2024-25. Our prudent corporate finance practices also ensured efficient finance costs during the year
p. 180 · Read in context →
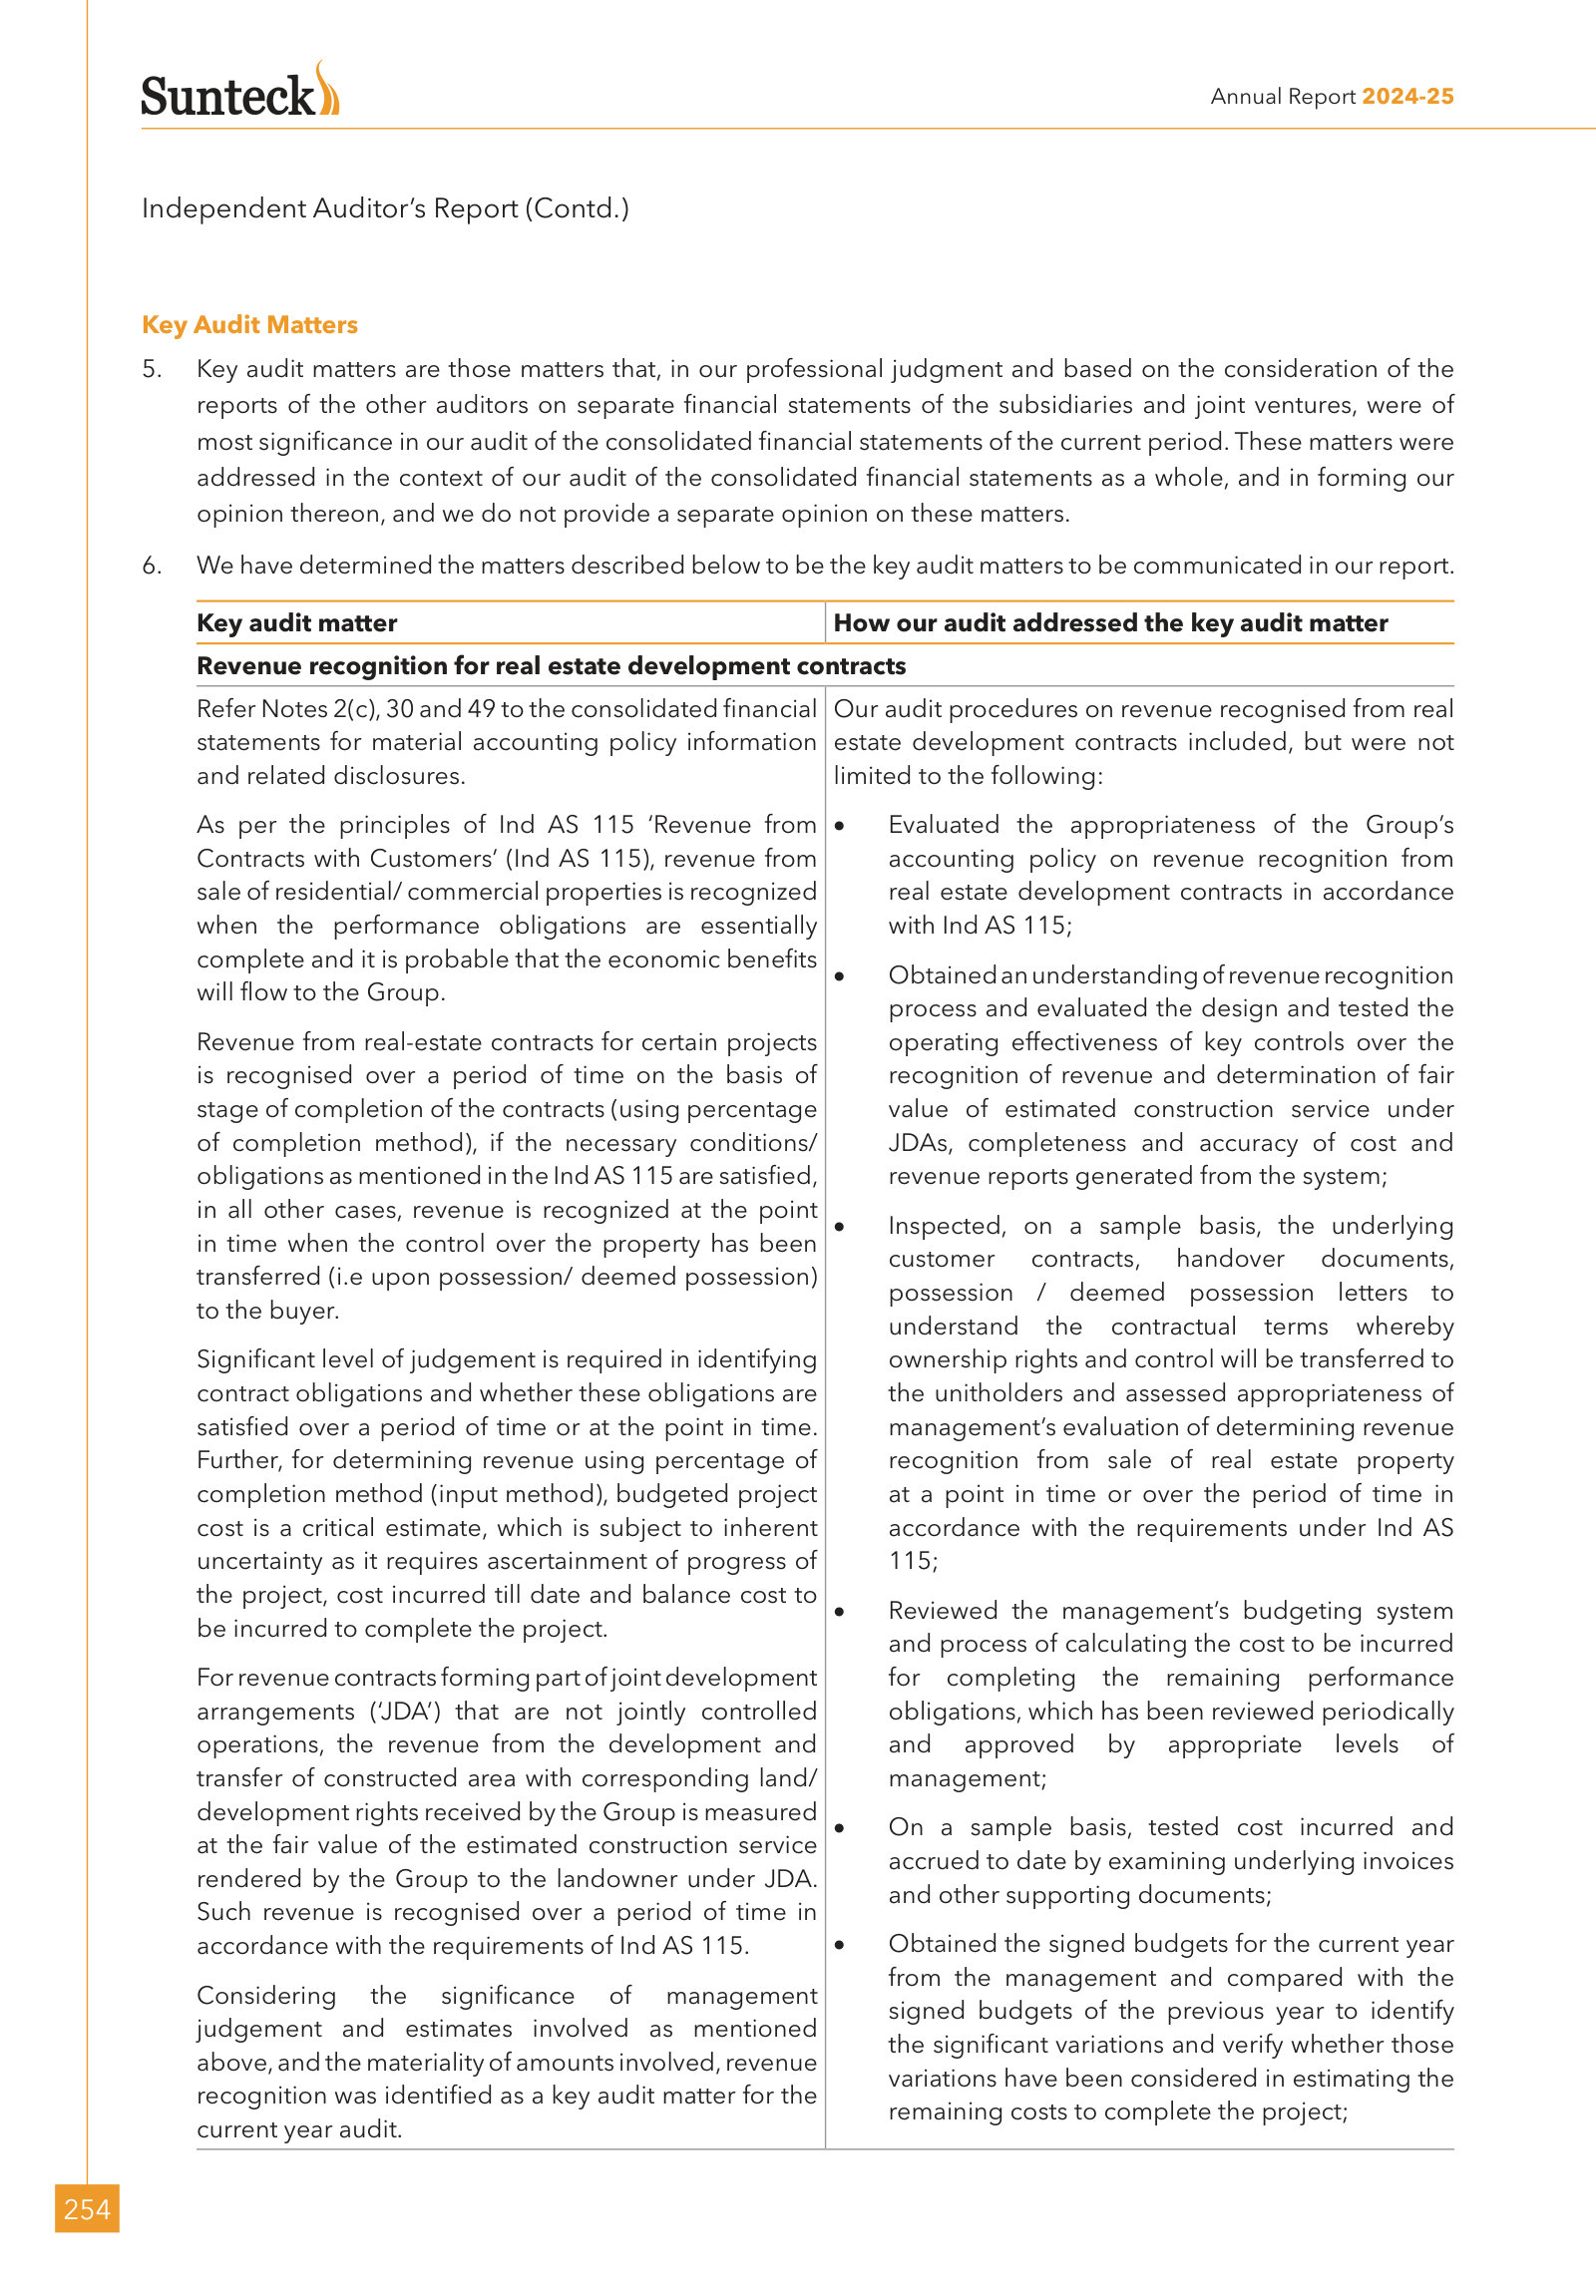
Revenue recognition for real estate development contracts — p. 292 · Read the full section →
Shows why completion timing, project-cost estimates and JDA fair values can materially move reported revenue.
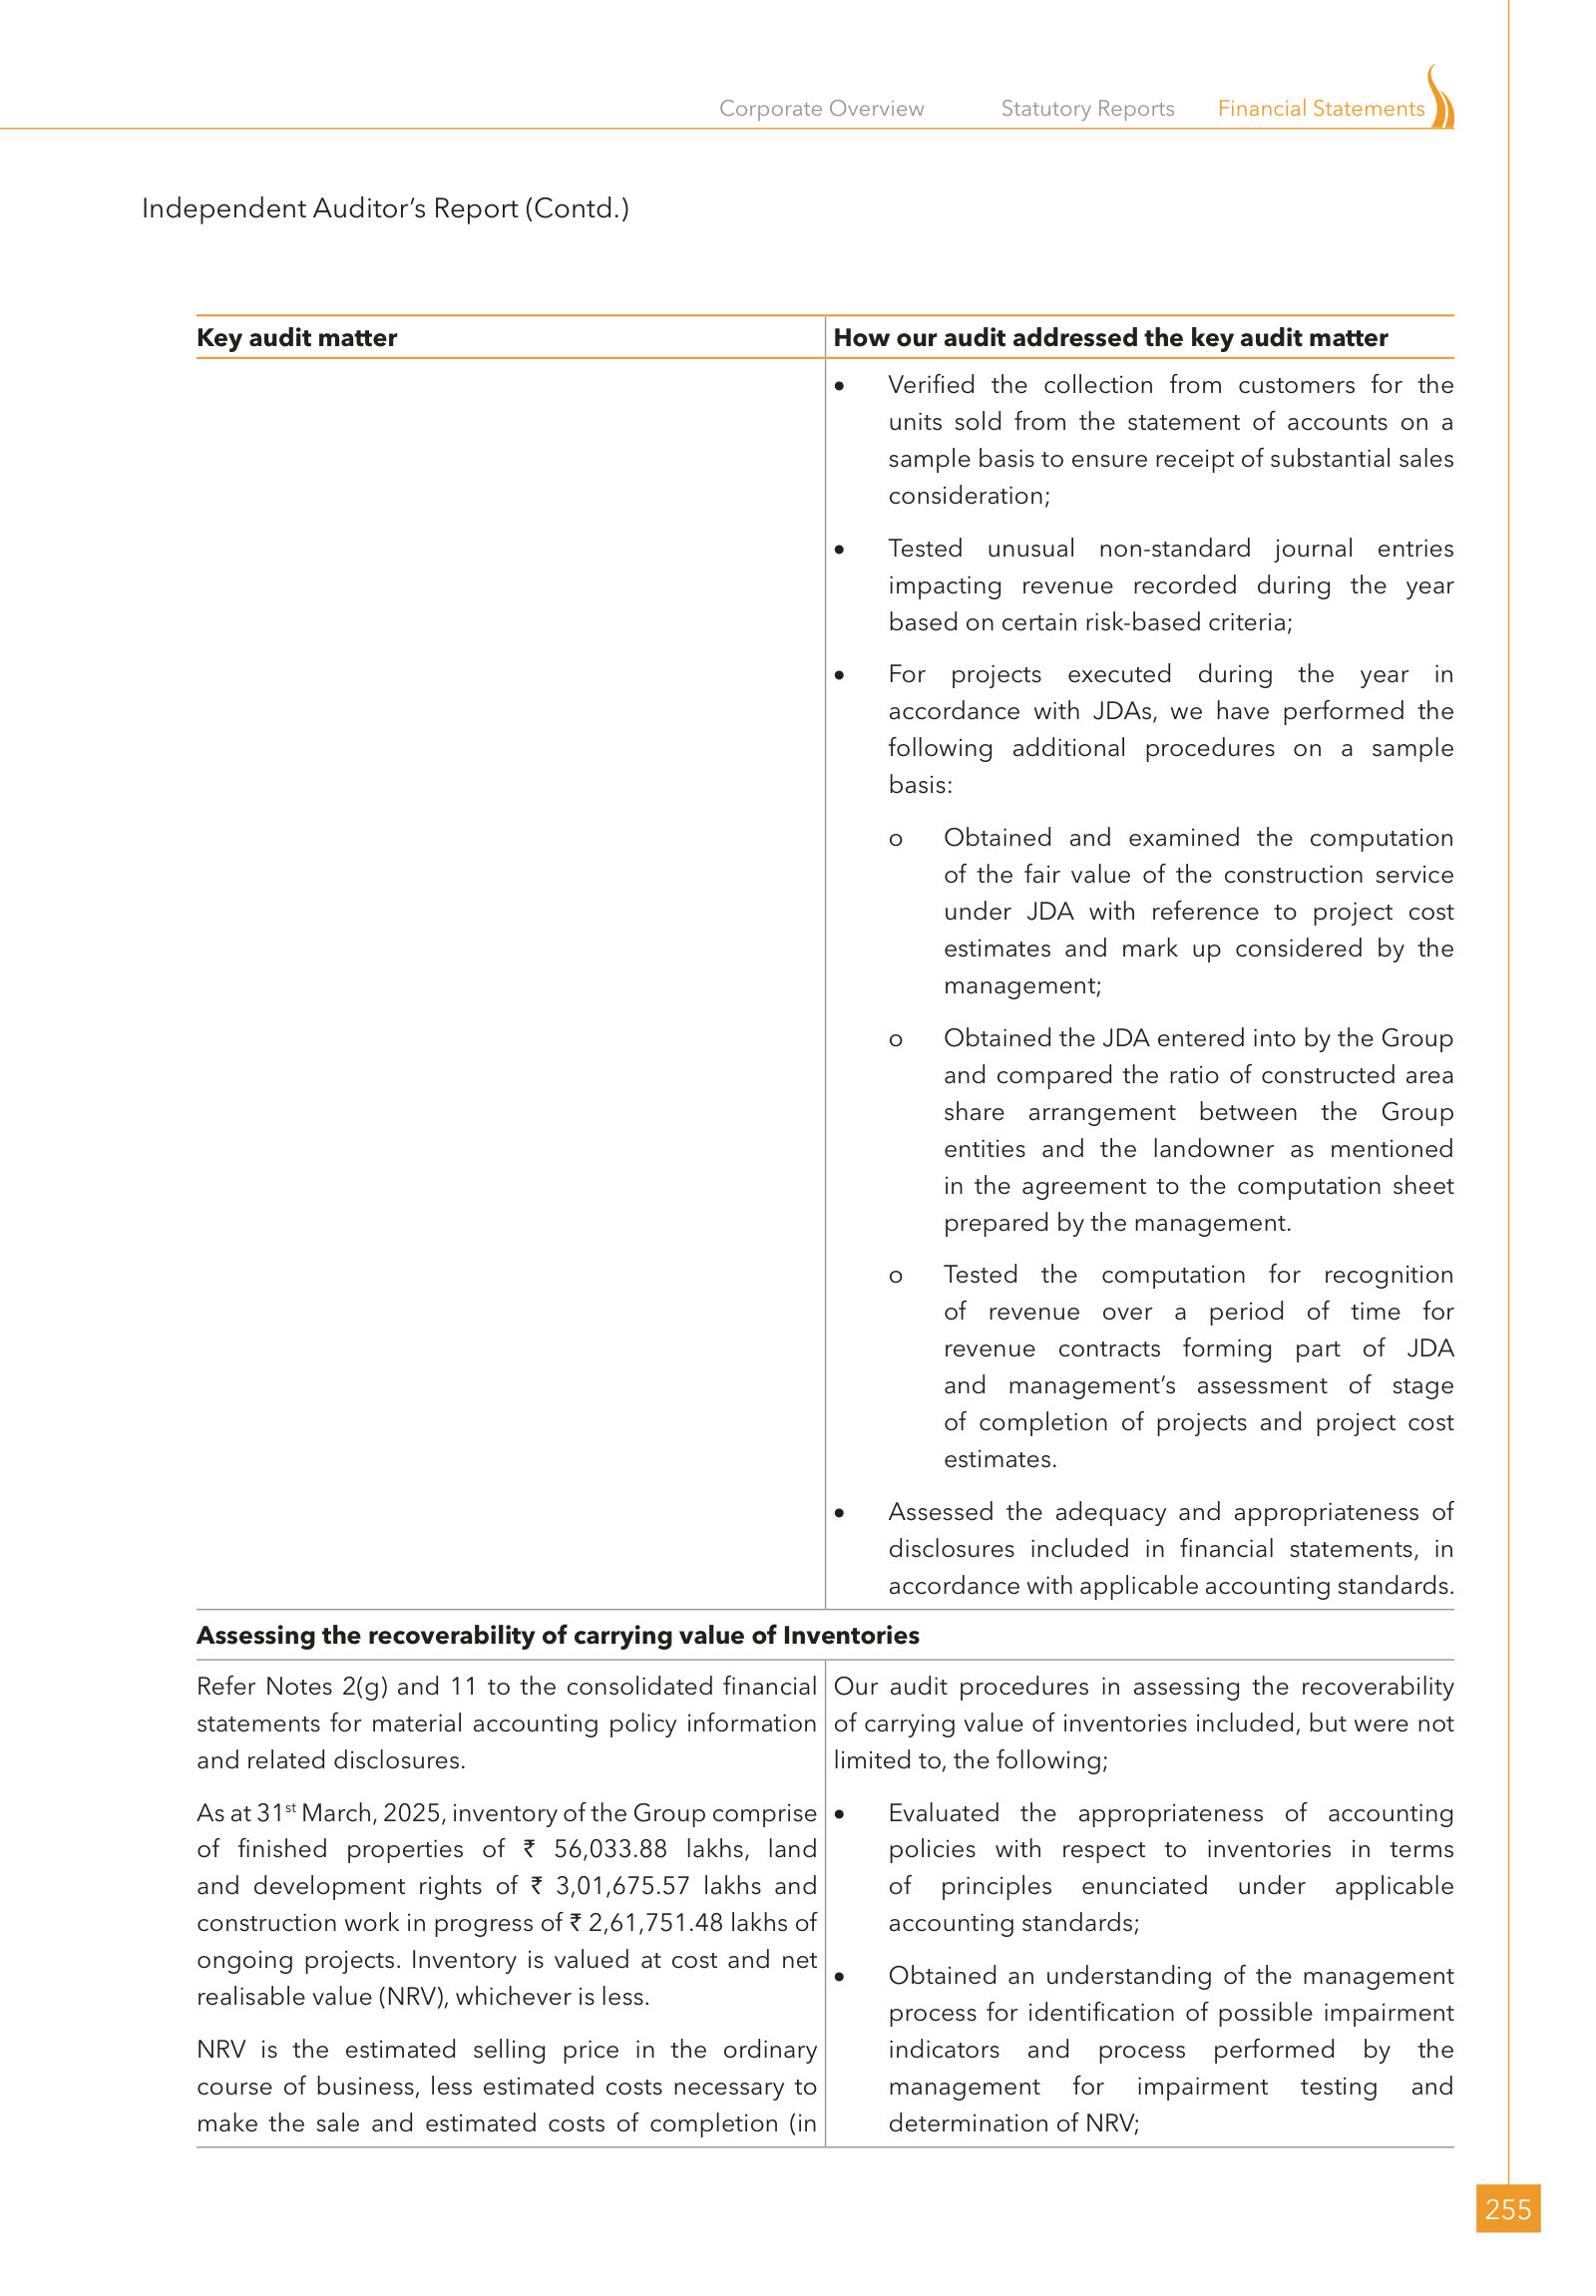
Assessing the recoverability of carrying value of Inventories — p. 293 · Read the full section →
Tests the assumptions supporting ₹6,194.6 crore of finished property, land rights and work in progress.

Impairment assessment of investments in and loans given to its joint ventures — p. 294 · Read the full section →
Isolates the delayed Dubai project and disputed CIDCO premium within ₹278.6 crore of JV exposure.
The Dubai JV dispute, settlement framework and remaining impairment judgment.
The Group’s non-current investments and non-current loans amounting to \
15,835.67 lakhs and \\4,519.59 lakhs respectively, as at 31<sup>st</sup> March, 2025 recoverable from GGICO Sunteck Limited (GGICO), a joint venture Company. The GGICO has an ongoing project for development of real-estate property in Dubai. Development of the project by GGICO has been delayed on account of certain disputes between the JV partners. Both the JV partners have initiated arbitration against each other before London Court of International Arbitration (LCIA) alleging non-compliance of certain conditions of the Joint Venture Agreement (JVA). The parties has arrived at an amicable settlement with respect to ongoing disputes and entered into a framework agreement on 26<sup>th</sup> March, 2024 as further explained in Note 57 to the consolidated financial statements.
p. 295 · Read in context →
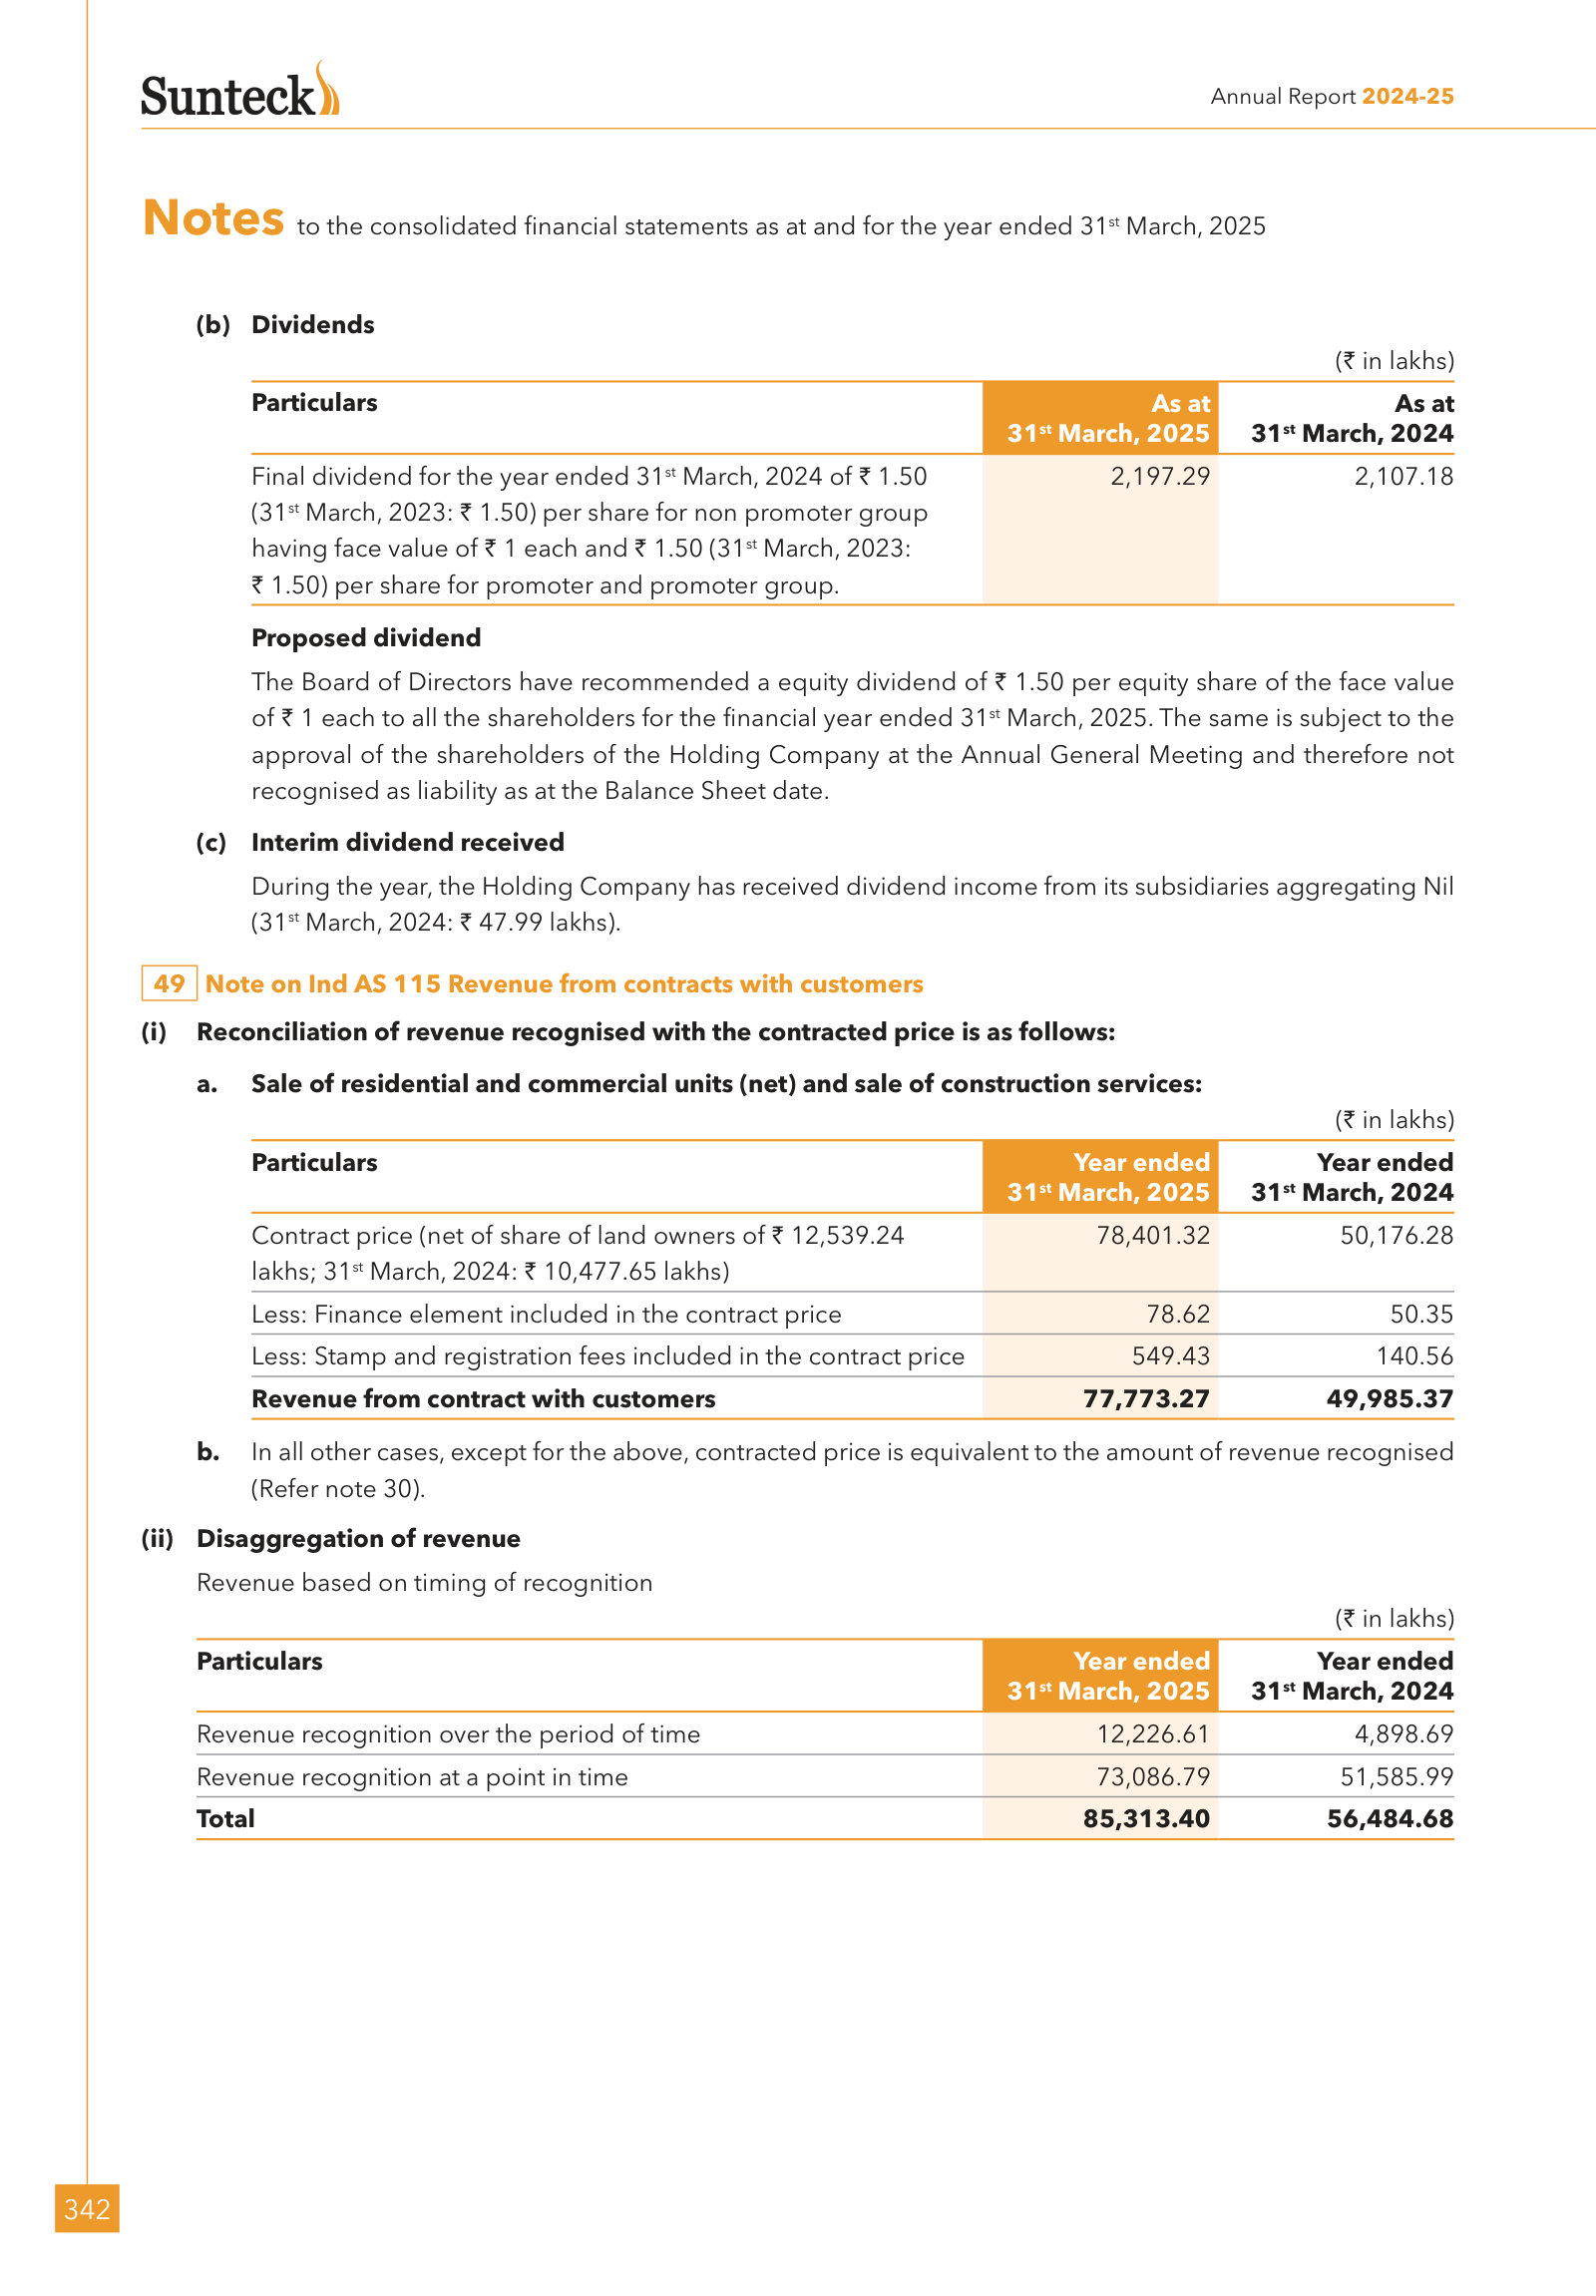
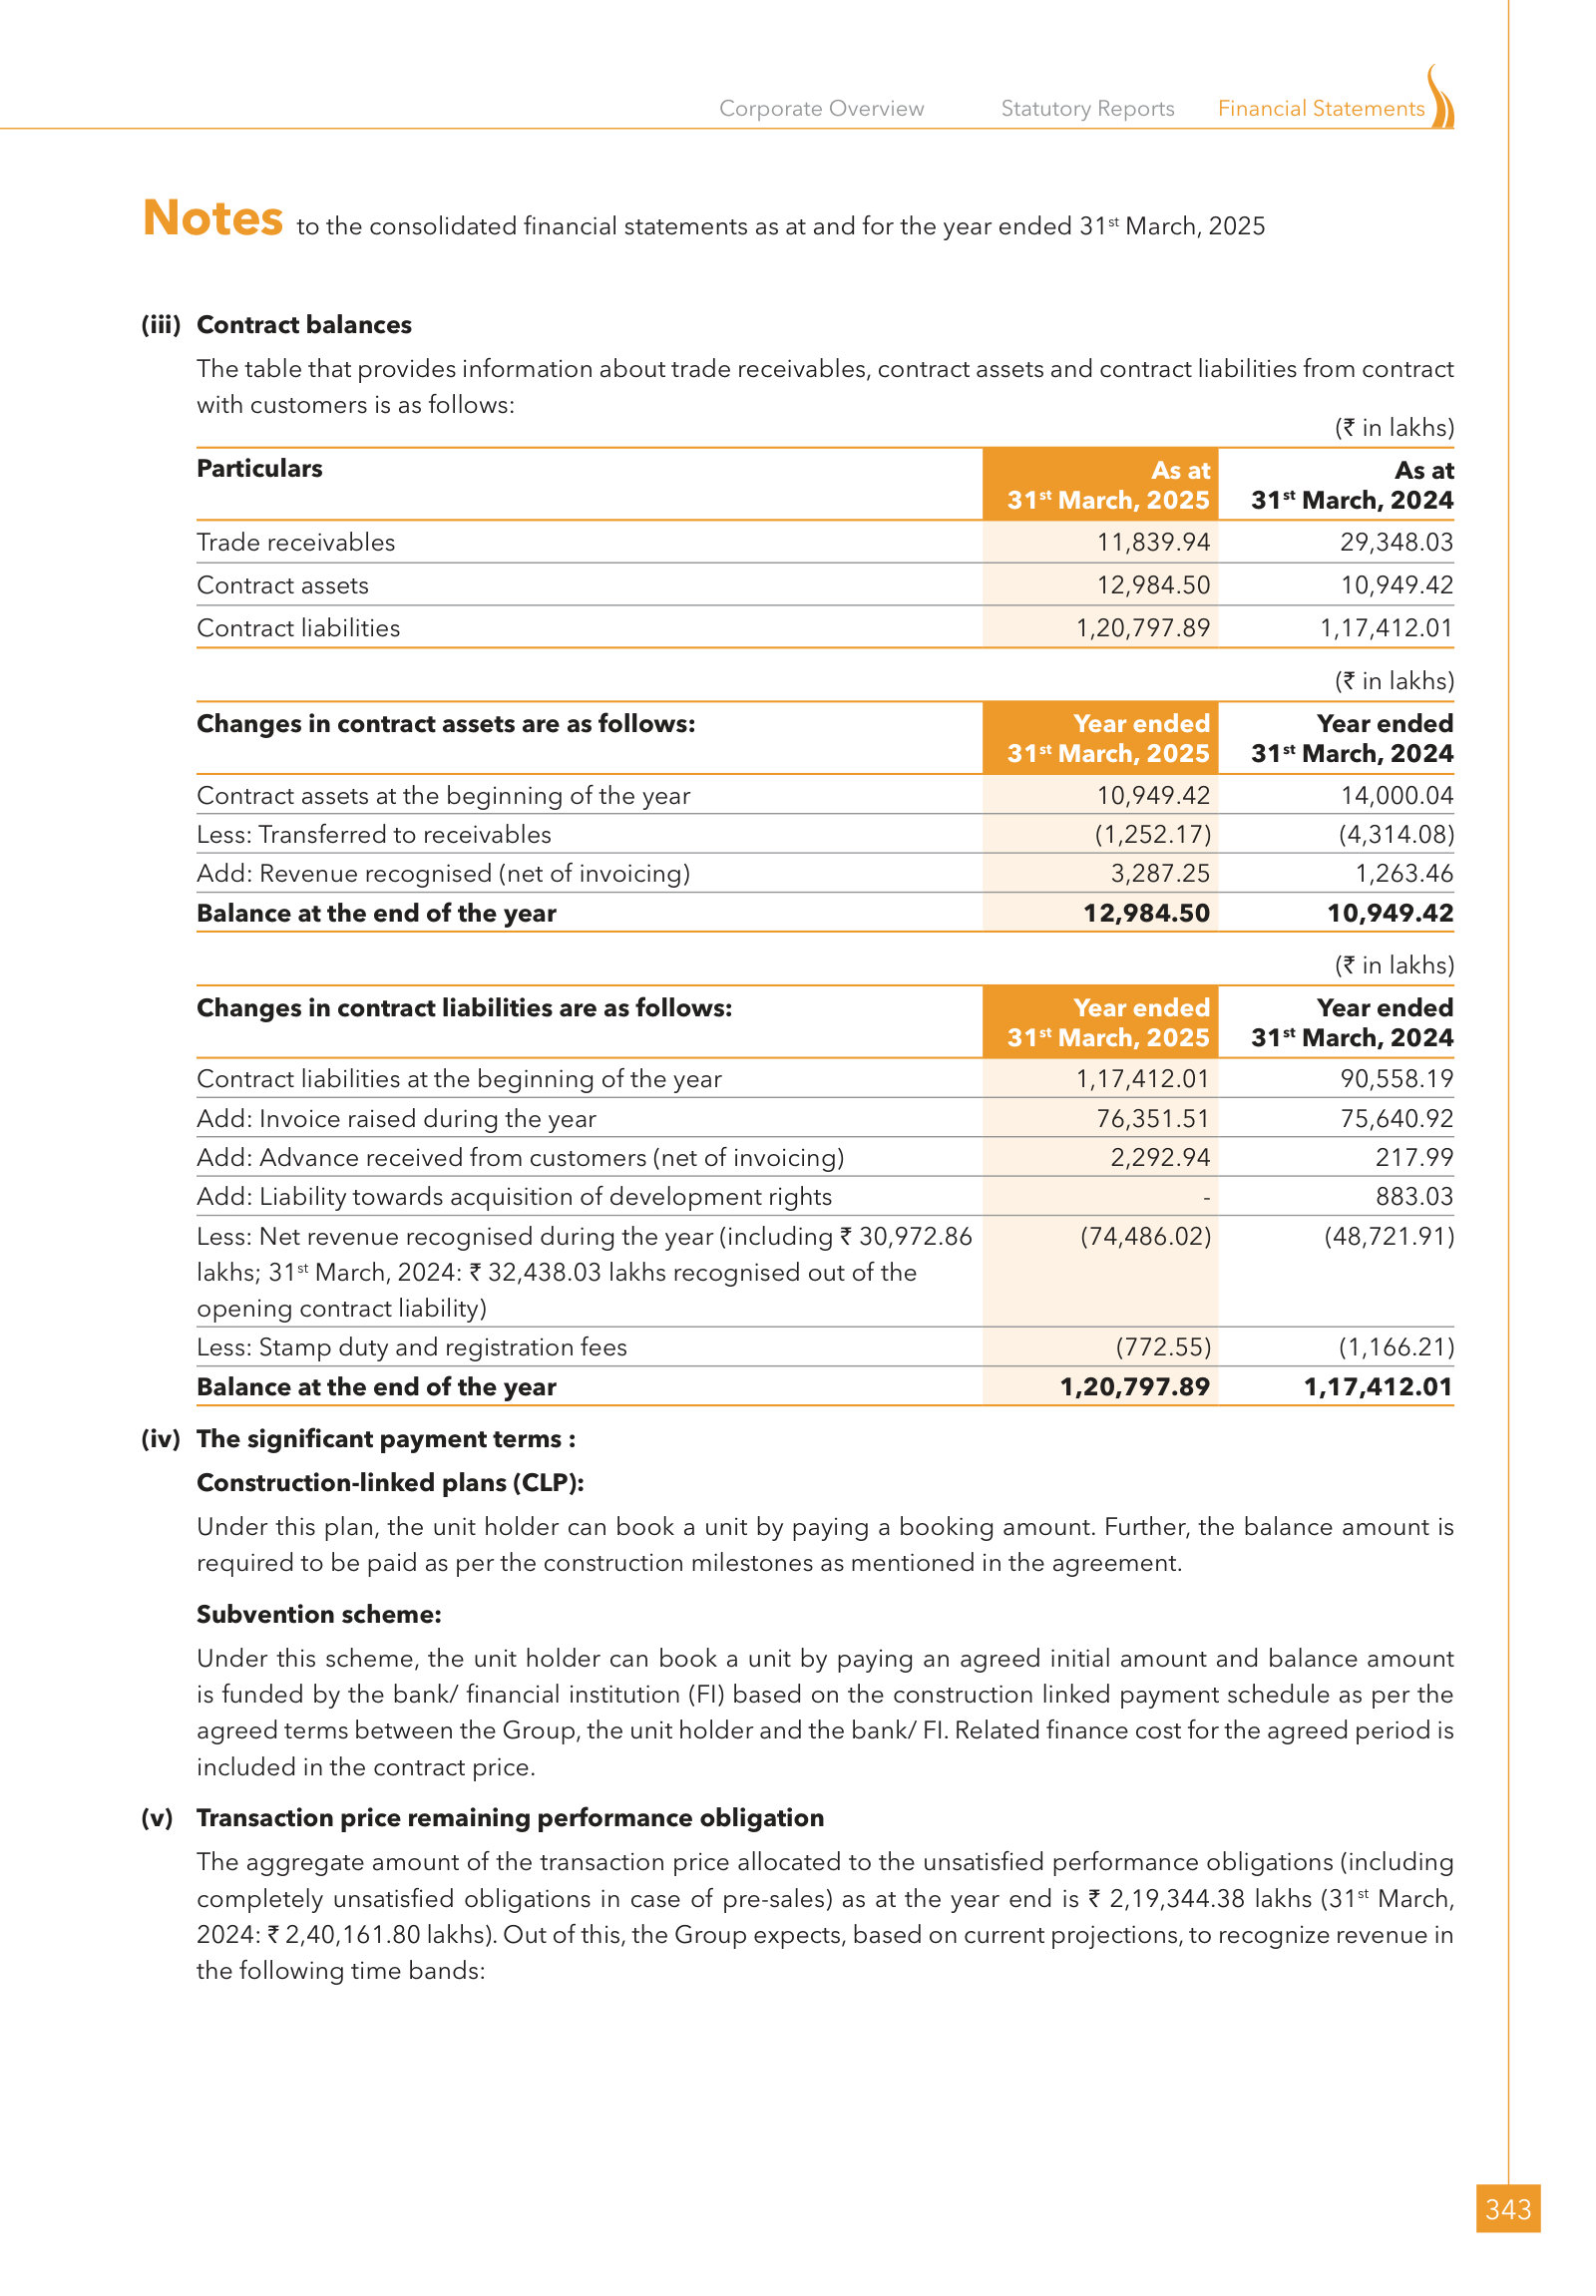
Note on Ind AS 115 Revenue from contracts with customers — p. 380 · Read the full section →
Explains revenue timing, customer advances and the contracted sales still waiting to enter reported revenue.
Segment reporting — p. 392 · Read the full section →
Clarifies that management treats development and related activities as one segment despite varied products.
The single-segment judgment and disclosed customer concentration.
Operating segments are reported in a manner consistent with the internal reporting provided to the Chief Operating Decision Maker (CODM).
The Holding Company’s Chairman and Managing Director (CMD) is identified as the CODM as defined by Ind AS 108, Operating Segments. The CODM evaluates the Group’s performance and allocates resources based on an analysis of various performance indicators, however the Group is primarily engaged in only one segment viz., ‘Real Estate/Real Estate Development and Related Activities’ and that most of the operations are in India. Hence, the Group does not have any separate reportable Segments as per Indian Accounting Standard 108 “Operating Segments”.
## b) Entity wide disclosures
For the year ended 31<sup>st</sup> March, 2025 one (1) [31<sup>st</sup> March, 2024: One (1) ] customer individually accounted for more than 10% of the total revenue of the Group.
p. 392 · Read in context →
More annual reports
Sunteck Realty Limited — FY2024 Annual Report — FY2024 · 387 pages · The nearest baseline for comparing portfolio additions, presales and revenue recognition before FY2025’s Dubai activation. · Open →
Sunteck Realty Limited — FY2023 Annual Report — FY2023 · 345 pages · A pre-FY2025 view of the MMR-led portfolio and the early scale-up in premium and aspirational housing. · Open →
Sunteck Realty Limited — FY2022 Annual Report — FY2022 · 317 pages · Shows the portfolio and balance sheet as the post-pandemic housing recovery began to feed project expansion. · Open →
Sunteck Realty Limited — FY2021 Annual Report — FY2021 · 314 pages · The oldest available shelf edition, useful for tracing the starting portfolio and pandemic-era operating context. · Open →
Competitors describe Sunteck Realty Limited's market in their own filings and calls. These verified passages and visual pages show where their strategies meet, using source documents preserved in Sources.
Oberoi Realty Limited (OBEROIRLTY)
The closest product-and-geography match: Oberoi competes for premium and luxury residential demand across Mumbai's western and central suburbs, including Goregaon, Worli and Thane, while also operating office, retail and hospitality assets. Its Goregaon flagship directly overlaps Sunteck City's western-suburb catchment, and its current MMR land and redevelopment push competes for the same scarce development opportunities.
Oberoi's current reading of the shared Mumbai market: steady end-user demand, a preference for larger amenity-rich homes, and notable absorption in western and central suburbs as connectivity improves.
Mumbai’s real estate market continued to demonstrate resilience and steady demand over the past year, supported by strong end-user interest, infrastructure-led development, and a relatively stable macroeconomic environment. The city remains one of India’s most dynamic property markets, driven by its position as the country’s financial capital and a key hub for employment and investment. Residential real estate witnessed sustained traction, as homebuyers prioritized larger living spaces and improved amenities. Demand was supported by favourable financing conditions for much of the year and a continued shift from rental to ownership housing. Micro-markets such as the western suburbs, central suburbs, and select peripheral locations saw notable absorption, aided by improved connectivity and ongoing infrastructure projects
p. 30 · Read in context →
Oberoi's stated land pipeline collision: nearly 4 million square feet added across MMR micro-markets through acquisitions, redevelopment and partnerships, with an emphasis on high-value residential development.
On the business development front, the year was marked by strong momentum and strategic expansion, with the Company adding close to 4 million square feet of development potential across key micro-markets in the Mumbai Metropolitan Region. This growth was driven by a balanced mix of land acquisitions, redevelopment opportunities and strategic partnerships, further strengthening our future development pipeline. The Company also achieved important milestones in expanding its presence across high-value residential and hospitality-led developments, reinforcing its commitment to creating landmark destinations and delivering long-term value for stakeholders.
p. 7 · Read in context →
A concrete sales marker in Sunteck City's immediate western-suburb arena: Oberoi reports 887 Elysian units sold for ₹7,790 crore of cumulative sales value at its Goregaon flagship.
Cumulative units sold 887 units with Total Sales Value of ₹ 7,79,015.30 lakh, of which ₹ 5,01,123.26 lakh has been recognized as revenue till FY 2025-26
p. 32 · Read in context →
Keystone Realtors Limited (Rustomjee) (RUSTOMJEE)
A focused MMR developer and close size-and-geography peer spanning aspirational, premium and super-premium homes. Rustomjee competes with Sunteck across Bandra, Worli, Versova, Goregaon/Malad and peripheral MMR, and its redevelopment-led sourcing model contests many of the same Mumbai societies and land opportunities.
Rustomjee's filing sizes and segments the shared MMR housing pool: roughly 96,187 annual unit sales, western/central-suburb launch growth, and a pronounced shift toward ₹1 crore-plus and ₹2–5 crore homes.
MMR achieved residential sales of approximately 96,187 units in 2025, representing an 11% year-on-year increase and underscoring sustained buyer confidence. New project launches were closely aligned, totalling 96,470 units, which reflects a prudent balance between supply and demand. Sales activity was broad-based, with a notable rise in launch volumes across the western and central suburbs. […] Properties priced above INR 10 million have emerged as the dominant segment in the market, accounting for 34% of total residential sales in the second half of 2024 The INR 20–50 million segment, in particular, recorded a robust 34% year-on-year growth, reflecting sustained demand for high-value homes.
p. 35 · Read in context →
Prime competitive-landscape material: responding after an analyst cites Oberoi's recent super-luxury redevelopment wins, Rustomjee says it is active in the city, Bandra and Worli and regards itself as one of five sought-after high-end Mumbai developers.
Boman Irani: So without giving names, I can tell you that because the DA is still under finalization or under signing, I would not like to give names, but just tell you that we are very active in the super premium, whether that be in the city, whether that be in Bandra, whether it be in Worli. So we are definitely there. And we believe that of the 5 names that are known to do, I would say, high-end developments in Mumbai, we are definitely one of those that is sought after
p. 14 · Read in context →
Rustomjee's product-mix strategy lands squarely in Sunteck's aspirational-luxury range: it says most new business development targets ₹1–4 crore homes, while maintaining a premium/luxury pipeline.
Boman Irani: And like I said, the premium and luxury is something definitely that we continuously keep working towards. But a very large part of our BD continues to be in the INR1 crore to INR3 crores or INR1 crore to INR4 crores kind of segment price because that is the largest part of the market that is continually on an upswing and also allows developers to go ahead and make money, unlike affordable, which is probably the largest, but we do not see much happening on that front till such time as the government comes up with a reasonable ability to allow developers to make money out of doing affordable housing. So we will not focus over there.
p. 16 · Read in context →
Lodha Developers Limited (LODHA)
A broad MMR competitor with far greater scale but direct overlap across mid-income, premium, luxury and ultra-luxury housing. Lodha competes in South/Central Mumbai, the western suburbs, Thane and extended eastern MMR, and its land-acquisition, JDA and branded-developer strategy affects both customer demand and development sourcing for Sunteck.
Lodha's stated national share and runway: management puts the company at roughly 3.5% of primary housing sales across the top six cities despite ₹205 billion of FY2026 pre-sales.
Abhishek Lodha: The one other number that I want to highlight is market share. Despite all the growth that we've had, we are currently at about 3.5% of primary housing sales in the top 6 cities. This i the clearest statement I can make about the long runway ahead. Coming to fiscal '26. Fiscal '26 was a strong year operationally in spite of the macro challenges that we spoke about and the effect of the environmental clearances delay, which affected us on the construction side and in terms of new launches in the first 3 quarters of the fiscal. Presales of INR205 billion, up 16% with every single quarter delivering its best ever performance.
p. 4 · Read in context →
Lodha's sizing of South and Central Mumbai—over ₹400 billion of annual primary sales—and its claim that branded developers expanded their share from about 30% to 40%, alongside its own market-share gains.
Akshat Gupta: This market continues to present a large and structurally growing opportunity for us with an estimated yearly size of over INR 400bn primary market and a healthy 15% CAGR since financial year 2022, driven by both volume and price growth. At the same time, as Abhishek suggested, the market is witnessing a shift towards branded developers with their share increasing from roughly 30% to about 40% over similar time period, underscoring rising consumer preference for trust, quality and execution. If we especially talk about our current position, we have been growing at a strong pace of 25%- plus CAGR in the South & Central Mumbai, primarily led by our residential portfolio, maintaining our market leadership with expanding market share. Our growth is anchored on focused micro market selection, deep understanding of evolving consumer preferences and being able to identify market gaps to build differentiated segment-specific products.
p. 7 · Read in context →
Lodha's own account of the ultra-luxury contest: it says ₹50 crore-plus homes nearly doubled their market mix and claims a 40% share of South/Central Mumbai's ₹100 crore-plus category.
Nishant Bhasin: The share of INR50 crores plus residences has nearly doubled since financial year '24, increasing from 7% to 13% of the overall market. At the same time, supply remains highly constrained with Grade A developers contributing to 75% of the INR50 crores plus category and 100% of the INR100 crores plus category. What this essentially indicates is a clear consolidation and consumer preference towards branded, trusted developers at the top end. Against this background, we have made significant strides in South & Central market over the past few years, scaling from a relatively limited presence in INR100 crores plus segment to becoming the leading player by sales in the region with a growth trajectory of 30% CAGR since financial year '23. This has been driven by strong adoption across marquee micro markets such as Malabar Hill and Worli. In this context, this segment continues to be a key strength for us, where we command a 40% market share in INR100 crores plus category today.
p. 8 · Read in context →
Godrej Properties Limited (GODREJPROP)
A national developer with a major and fast-growing Mumbai region business. Godrej competes with Sunteck from aspirational through luxury price points and is actively launching or expanding in Bandra, Worli, Vikhroli, Versova, Kharghar, Panvel and Thane—many of the same MMR corridors where Sunteck has current or planned inventory.
Godrej's view of the cycle it is pursuing: premium and luxury are taking a larger share of sales, while buyer preference is consolidating around large established developers.
The Indian real estate sector is evolving in ways that are directly relevant to how we operate and grow. Premium and luxury housing is commanding a growing share of overall sales, with average ticket sizes rising steadily, reflecting a structural shift from volume-led expansion to value-led growth. We have been deliberately strengthening our presence in this segment for several years, tapping into the market trend with agility. Buyer preference has consolidated around trust, with large, established developers gaining market share on the back of consistent delivery and transparency. This works in our favour, but equally reinforces the importance of continuing to deliver on every commitment, across every project and market.
p. 17 · Read in context →
Godrej's stated scale and share: ₹34,171 crore of FY2026 bookings and a claimed 4.8% share of tier-one-city sales in CY2025.
FY 2025–26 marked another year of strong growth, with booking value increasing to ₹34,171 crore, supported by broadbased demand, strong collections, and disciplined business development. As the No. 1 developer in India by booking value, volume, and collections, and with a market share of 4.8%
p. 27 · Read in context →
Godrej's FY2027 Mumbai launch map overlaps multiple Sunteck corridors: Bandra, Worli, Vikhroli, Kharghar/Panvel and Thane, with further phases planned in already-selling projects.
Gaurav Pandey: In Bombay, again, quite action packed. We will have Bandra is the most awaited launch for Bombay in the last many years, that should come. We will have phase activations in Kharghar and Panvel. We will also launch the tower of Worli. As you would have seen, we've been clocking sales pretty strongly. So, I think somewhere around Diwali this year, we might open a new phase of Worli. We will also see after a very long time, a very exciting land parcel coming in Vikhroli. And the teams are quite excited about that. This is a huge project. And towards maybe quarter 2 or quarter 3, we would see a launch of this one. Then we will have a tower activation of Godrej Reserve. And the recent acquisition, the INR7,500 crores top line that we have acquired in Thane, that should also see a launch in towards – mostly like towards – late Q3 or Q4.
p. 16 · Read in context →
Ajmera Realty & Infra India Limited (AJMERA)
A Mumbai-focused developer of comparable scale whose premium and aspirational projects compete for buyers in Wadala, Bandra, Versova, Vikhroli, Bhandup, Ghatkopar and Andheri. Its township positioning, owned-land pipeline and redevelopment ambitions make it a relevant local competitor despite a smaller overall platform.
Ajmera's product-allocation view for its two core cities: it designs by micro-market and says Mumbai demand is currently strongest in mid-income and luxury housing rather than affordable stock.
Dhaval Ajmera: So look, the market where we are operating, that is Mumbai and Bangalore has been thriving over the last 5, 7 years. Urbanization and redevelopment and new projects in these cities have been significantly moving faster. Every location and every suburb of the city has a different requirement in terms of the housing, whereas just to give an example, if it is Bangalore, some places where only plotting or villas will work, some places, affordable housing or 2-bedrooms will work or probably in a better location, a bigger 3-bedroom or a 4-bedroom work. And similarly is the case in Mumbai. So we need to analyze based on those projects and based on those micro markets, and that's how we take our decisions to design. So but just to give a general feedback, I think more important in Mumbai right now because of the affordable housing policies is not very favorable in terms to the customer and the developer. That's not moving too well, but the mid-income and the luxury segment primarily in Mumbai, I would say, is moving significantly well, and that is seeing a good traction. And that will continue to do so in my sense over the next few years more, unless there is a change in the affordable housing policies, which will take up and then that may pick up also too good.
p. 6 · Read in context →
A pointed Wadala competition exchange: an investor asks twice about Raymond's stronger launch sales, while Ajmera argues its township amenities support pricing and better sustenance sales.
Abhi Shah; Dhaval Ajmera: Okay. And do you have any competition like from Raymond? Like is it a steep competition from Raymond? And also, can we see that around a 10% to 15% price increase every year? […] See, competition is there. But as I said, we get the benefit in our project is more of a township development. So, when I look at a larger township development with more than about 6 - 7 acres of podium and different towers and car-free podium with the entire amenity then we have narrowed down or probably we are the only player in the micro market of probably that region, which offers such kind of amenities. So, when people come to look at amenity, security and overall look and feel we win an edge over the others and that's where we see demand coming in a good number and pricing also not being too much of an issue with the competition around. […] But when we heard about Raymond con-call, the Raymond has sold more than what you are selling right now. So, I think so you are facing a steep competition over there. […] No. So, launch, everyone does. So even if you look at the launch when we did our Manhattan 2 launch, we've sold more than about 40% during our launch phase itself, which is about INR70 crores odd of sales we did in one particular like 15 days or 20 days. So, and that's how every launch will be a successful launch. But as the overall sustenance mode, do we sell better? My answer would be yes, with the amenities and surrounding.
p. 13 · Read in context →
Kolte-Patil Developers Limited (KOLTEPATIL)
Primarily a Pune developer, but a genuine secondary competitor through its Mumbai redevelopment portfolio and its mid-premium, premium and 24K luxury brands. Its current Versova and Dahisar pipeline and stated intention to expand across MMR put it in several of Sunteck's western-suburb catchments, though at smaller Mumbai scale than the peers above.
Kolte-Patil's latest segmentation of Mumbai supply: ₹1–3 crore homes were 48% of Q1 2026 launches, luxury/high-end another 27%, with the western suburbs leading new supply.
A notable feature of the Mumbai market was its ability to sustain price growth while reducing inventory. Unsold stock declined 6% year-on-year to 155,604 units at the end of 2025, resulting in a balanced QTS metric of 6.4 quarters. This reflects the market’s depth, liquidity and capacity to absorb new supply despite elevated property values. The market continued to witness a clear shift towards premium housing. During Q1 2026, homes priced between H1 crore and H3 crore accounted for 48% of new launches, while the luxury and high-end segment contributed a further 27%. At the same time, the share of homes priced below H50 lakh declined, highlighting changing buyer preferences and increasing premiumization. Geographically, the Western Suburbs led new supply, followed by the Eastern Suburbs, Navi Mumbai and Thane, while peripheral suburban locations continued to attract demand due to improving connectivity and relative affordability.
p. 51 · Read in context →
Kolte-Patil's stated MMR collision: a Versova launch, two delayed Dahisar projects, and a business-development priority to expand across MMR beyond redevelopment as infrastructure opens micro-markets.
Atul Bohra: Okay. So from Mumbai pipeline of our total project which are under approval, as I already mentioned that Laxmi Ratan Versova project is all set for the launch during quarter 2. However, there are a few projects which are mainly on account of certain eco-sensitive zone related environment clearance approval, which are a little bit getting delayed. There are 2 projects at Dahisar, which are delayed in launches on account of pending height clearance. So even though these projects are under approval phases, but despite it is more or less industry-wide issue, so as of now, it is difficult to comment on those launches. But we are quite hopeful once this issue will be on track, we will definitely try to launch these projects sooner. […] As an overall business development, as I already mentioned that the primary focus, the sustainable operating cash flow in hand, the Blackstone infusion. And with all this respect, business development is on our top priority. That will be definitely better than the last year. We intend to expand our footprint in MMR region as well beyond re-development. And definitely, we will capitalize on that huge MMR opportunity with the infra growth.
p. 13 · Read in context →
More peer documents
Oberoi Realty FY2025 Annual Report — FY2025 · 281 pages · Useful prior-year baseline for Oberoi's western-suburb, Thane and ultra-luxury project scale before the latest MMR business-development additions. · Open →
Lodha FY2026 Annual Report — FY2026 · 315 pages · Expands on Lodha's portfolio across mid-income, premium and luxury housing, its JDA/land-acquisition mix, and its view of branded-developer consolidation. · Open →
Lodha Q1 FY2026 Earnings Call — Q1 FY2026 · 19 pages · Management discusses supply constraints at top branded developers, weekly non-launch sales and the premiumisation of Palava. · Open →
Godrej Properties Q1 FY2026 Earnings Call — Q1 FY2026 · 19 pages · Contains an analyst-led discussion of the demand cycle plus Godrej's then-planned Worli, Versova, Panvel and Kharghar launches. · Open →
Godrej Properties FY2025 Annual Report — FY2025 · 276 pages · Provides the preceding market-share, bookings and city-mix baseline for measuring Godrej's rapid expansion into the current year. · Open →
Rustomjee Q1 FY2026 Earnings Call — Q1 FY2026 · 13 pages · Details ₹7,727 crore of redevelopment additions, new entry into Sion and Lokhandwala, and an analyst question on rising competitive intensity. · Open →
Ajmera Realty FY2025 Annual Report — FY2025 · 144 pages · Maps Ajmera's Mumbai premium portfolio and gives its filing-level view of Mumbai demand, pricing and infrastructure drivers. · Open →
Kolte-Patil FY2025 Annual Report — FY2025 · 345 pages · Shows the earlier Mumbai redevelopment footprint, the 24K luxury positioning and the relative scale of its Mumbai project pipeline. · Open →
Source: S&P Capital IQ transcripts via Xpressfeed · latest indexed call 2026-04-22 · generated 2026-07-22.
Latest call digest
Sunteck Realty Limited, Q4 2026 Earnings Call, Apr 22, 2026 · 2026-04-22T10:30:00
On Apr 22, 2026, prepared remarks framed FY '26 around 25% presales growth, a net cash flow surplus of INR 5.5 billion, heavier business-development investment and negligible leverage. The Q&A was more conditional: Dubai was launch-ready but deferred until the Middle East conflict settles, collections had grown more slowly than presales, and analysts tested whether FY '27 growth could hold without Dubai. Management still guided to similar 25% presales growth in FY '27 even without Dubai, outlined close to INR 7,000 crores of launch GDV plus Nepean Sea Road, BKC and existing inventory, and targeted a 35% to 40% blended EBITDA margin. It also acknowledged stable rather than rising prices, softer recent footfalls with similar conversion, and some finished-goods supply constraints.
Participant coverage from the latest call.
| Group | Participants | Count |
|---|---|---|
| Management | Operator; Kamal Khetan — Chairman & MD, Sunteck Realty Limited; Prashant Chaubey — Chief Financial Officer, Sunteck Realty Limited | 3 |
| Analysts | Kunal Lakhan — Research Analyst, CLSA Limited, Research Division; Pritesh Sheth — Analyst, Axis Capital Limited, Research Division; Puneet Gulati — Analyst of India Energy Transition and Property & Infra, HSBC Global Investment Research; Rishith Shah — Research Analyst, Axis Capital Limited, Research Division; Abhinav Sinha — Equity Analyst, Jefferies LLC, Research Division; Unknown Analyst; Akash Gupta — Analyst, Nomura Securities Co. Ltd., Research Division | 7 |
Curated latest-call exchanges; one row per analyst topic.
| Analyst | Firm | Topic | What changed in Q&A |
|---|---|---|---|
| Kunal Lakhan | CLSA Limited, Research Division | Dubai timing and cash conversion | He pressed first on launch timing and demand after the Middle East conflict, then on collections growing more slowly than sales. Management made Dubai timing event-dependent and expected stronger cash flow in FY '27 and FY '28 without giving a collection target. |
| Pritesh Sheth | Axis Capital Limited, Research Division | Launch capacity and margins | He asked what can launch apart from Dubai, the associated GDV and the margin profile of recent acquisitions. Management listed multiple MMR launches and separated blended margin expectations from lower project-level expectations on new deals. |
| Puneet Gulati | HSBC Global Investment Research | Pricing, war effects and Dubai investment | He tested whether pricing, footfalls, conversion and materials had weakened, then asked for cash invested in Dubai. Management expected stable pricing, described a modest footfall decline with similar conversion, and disclosed the initial and additional Dubai funding separately. |
| Abhinav Sinha | Jefferies LLC, Research Division | Growth without Dubai and Nepean Sea approvals | He challenged whether presales growth could hold without Dubai and whether Nepean Sea Road approvals and construction could progress in FY '27. Management expressed full confidence on ex-Dubai growth and expected action within the first two quarters. |
| Akash Gupta | Nomura Securities Co. Ltd., Research Division | Demand durability and incentives | He contrasted management's growth stance with slowdown concerns and asked whether discounts or aggressive payment plans were supporting demand. Management cited end-user demand, more launches and a low base, and denied discounting. |
Theme tracker
Themes are curator-classified across supplied calls.
| Theme | Status | Quarters mentioned | Read-through |
|---|---|---|---|
| Dubai launch timing | persisted | Q1 FY2025, Q2 FY2025, Q3 FY2025, Q4 FY2025, Q1 FY2026, Q2 FY2026, Q3 FY2026, Q4 FY2026 | The launch window moved from FY '26 confidence to launch-ready status and then became conditional on the Middle East conflict. Low land cost and limited project debt remained management's recurring defenses. |
| Presales-to-collections conversion | persisted | Q1 FY2024, Q2 FY2024, Q4 FY2024, Q1 FY2025, Q2 FY2025, Q3 FY2025, Q4 FY2025, Q1 FY2026, Q2 FY2026, Q3 FY2026, Q4 FY2026 | Analysts repeatedly questioned why collections trailed presales. Management consistently tied the catch-up to construction and completion milestones; the latest call shifted the expected cash-flow strength into FY '27 and FY '28. |
| Premium and uber-luxury mix | persisted | Q4 FY2024, Q1 FY2025, Q2 FY2025, Q3 FY2025, Q4 FY2025, Q1 FY2026, Q2 FY2026, Q3 FY2026, Q4 FY2026 | BKC and Nepean Sea Road increasingly carried presales and margin expectations. The latest call kept this mix central while arguing that aspirational luxury was also beginning to recover. |
| GDV expansion with balance-sheet discipline | persisted | Q1 FY2024, Q2 FY2024, Q3 FY2024, Q4 FY2024, Q1 FY2025, Q2 FY2025, Q3 FY2025, Q4 FY2025, Q1 FY2026, Q2 FY2026, Q3 FY2026, Q4 FY2026 | Management repeatedly paired aggressive project additions with low leverage, high IRR and high equity multiples. FY '26 brought visibly higher deployment, but the return discipline remained the stated constraint. |
| Aspirational-luxury recovery | emerged | Q3 FY2026, Q4 FY2026 | Management first described improvement in lower-ticket categories late in FY '26 and repeated the point at year-end, linking it to lower home-loan rates and income-tax benefits. |
| Stable pricing and volume over price | persisted | Q3 FY2024, Q4 FY2024, Q1 FY2025, Q2 FY2025, Q4 FY2025, Q3 FY2026, Q4 FY2026 | Management repeatedly prioritized sales velocity over broad price increases. The latest call made the caution more explicit by saying stable pricing should be sufficient. |
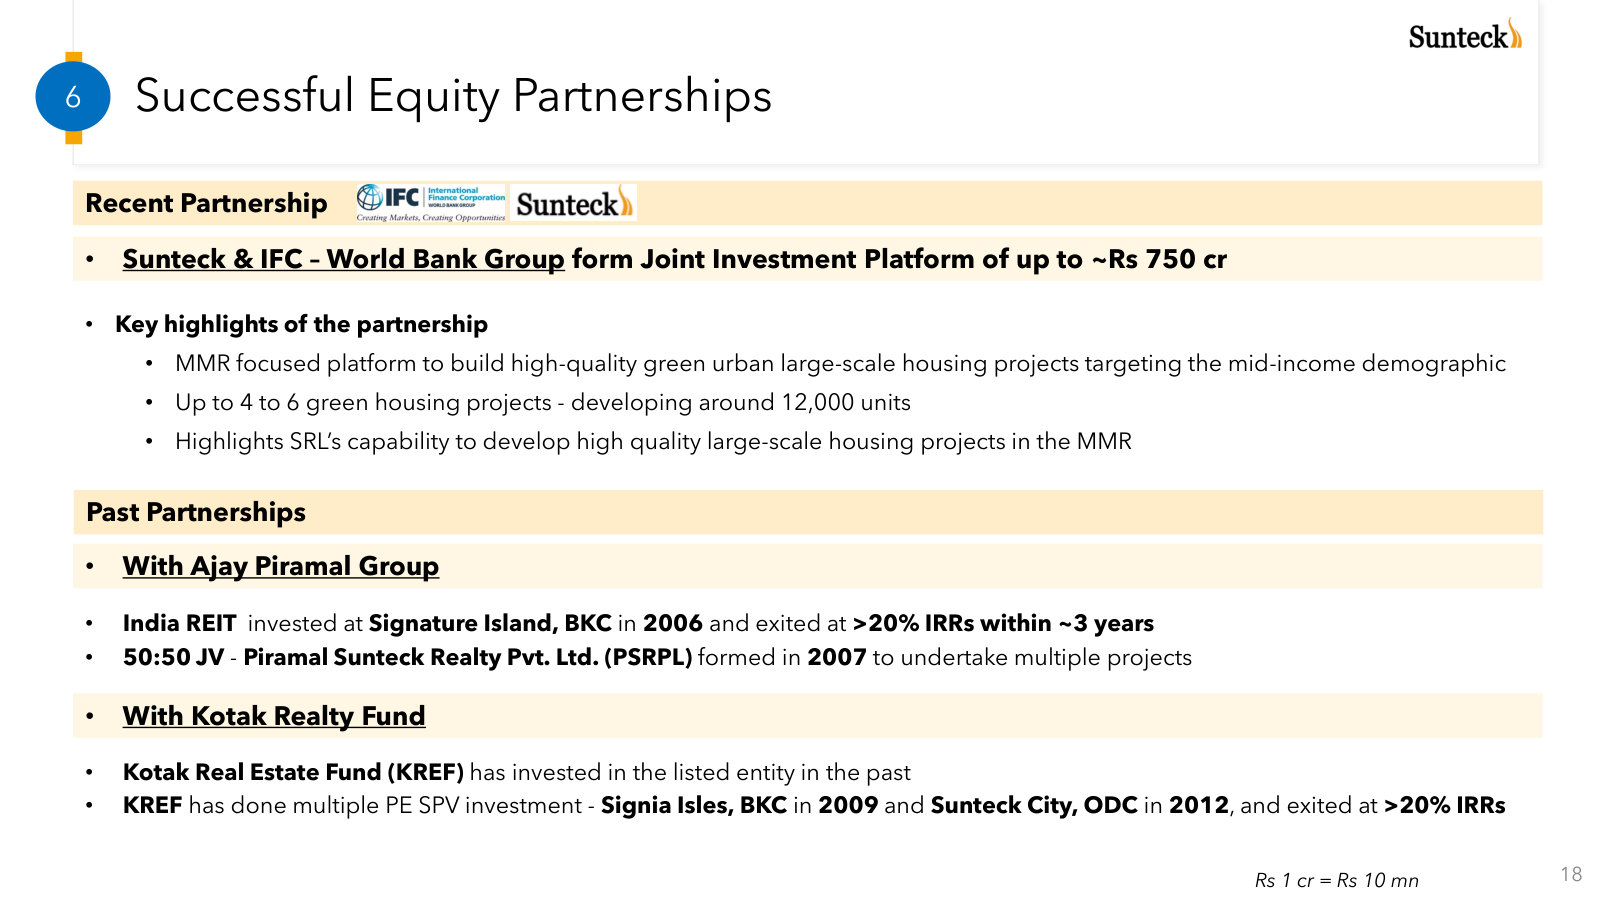
| IFC mid-income platform | dropped | Q2 FY2024, Q3 FY2024, Q1 FY2025 | The platform was initially presented as a meaningful route to mid-income GDV additions and was revisited in Q&A, but it disappeared from the subsequent call record while direct business development became the focus. |
Guidance ledger
Quotes, calls, and speakers are source-verified; outcomes are curator-classified.
| Verbatim guidance | Call | Speaker | Curator outcome | Outcome note |
|---|---|---|---|---|
| “With a strong start to this financial year, we remain confident to achieve 30% to 35% growth in presales for the FY '25 as we had guided at the beginning of the year.” | Sunteck Realty Limited, Q1 2025 Earnings Call, Aug 16, 2024 · 2024-08-16T10:30:00 | Kamal Khetan | kept | FY '25 presales grew 32%. |
| “So we are very, very confident that all these 3 projects which are newly added in the GDV value, which is Nepean Sea Road, Dubai and the Bandra West project, all 3 projects will be launched in FY '26 – before the end of FY '26.” | Sunteck Realty Limited, Q2 2025 Earnings Call, Nov 13, 2024 · 2024-11-13T10:30:00 | Kamal Khetan | missed | At FY '26 end, Dubai remained unlaunched and contingent on the Middle East conflict, so the all-project commitment was not met. |
| “So what we are talking about to start that project is after our launch of very soon the launch of this – 5th Avenue, which we are launching in ODC and we are looking to complete that project, the commercial project in FY '27-'28, FY '28.” | Sunteck Realty Limited, Q3 2025 Earnings Call, Jan 21, 2025 · 2025-01-21T11:00:00 | Kamal Khetan | pending | The completion window has not yet arrived; the latest call said construction was expected to start very soon. |
| “And we are confident you'll see that similar growth of 30%, 35% in even our revenue and our margins as well as our bottom line.” | Sunteck Realty Limited, Q4 2025 Earnings Call, May 05, 2025 · 2025-05-05T10:30:00 | Kamal Khetan | kept | FY '26 revenue, EBITDA and PAT grew 32%, 64% and 34%, respectively. |
| “With this project, and more to be added in coming quarters, we are confident of taking our GDV to more than INR 500 billion from the current GDV of INR 400 billion.” | Sunteck Realty Limited, Q1 2026 Earnings Call, Jul 18, 2025 · 2025-07-18T10:30:00 | Kamal Khetan | missed | The call later set FY '26 March as the deadline; FY-end GDV was approximately INR 441 billion. |
| “I repeat this, we have set a target to launch new projects worth INR 110 billion GDV value in the coming 3 quarters of the financial year FY '26.” | Sunteck Realty Limited, Q1 2026 Earnings Call, Jul 18, 2025 · 2025-07-18T10:30:00 | Kamal Khetan | unknown | The FY-end call did not state aggregate GDV launched against this target. |
| “So if I'm saying – I want to very clarify that if our presales grows by 30%, 35%, we might not grow collection by 30%, 35%, but we can decently look at anything closer to 20% or – around that area.” | Sunteck Realty Limited, Q1 2026 Earnings Call, Jul 18, 2025 · 2025-07-18T10:30:00 | Kamal Khetan | missed | FY '26 collections grew 14%. |
| “That's why we are confident of 30%, 35% growth in even our presales and GDV as well.” | Sunteck Realty Limited, Q2 2026 Earnings Call, Oct 20, 2025 · 2025-10-20T10:30:00 | Kamal Khetan | missed | The FY-end call reported presales growth of 25% and GDV of approximately INR 441 billion. |
| “So I've been saying – I think we were looking at end of this quarter, and it is – it's hopeful that we will – we should get by end of this quarter or Q1 of FY '27.” | Sunteck Realty Limited, Q3 2026 Earnings Call, Jan 28, 2026 · 2026-01-28T10:30:00 | Kamal Khetan | pending | The latest call still expected Nepean Sea Road approvals and construction activity in the first 2 quarters of FY '27. |
| “We are very, very confident about our growth of the whatever we have done in the current year, similar growth of 25% in the coming year as well.” | Sunteck Realty Limited, Q4 2026 Earnings Call, Apr 22, 2026 · 2026-04-22T10:30:00 | Kamal Khetan | pending | This is the FY '27 presales growth commitment and the measurement period is still open. |
| “So blended EBITDA margin, we are looking at minimum 35% to 40%.” | Sunteck Realty Limited, Q4 2026 Earnings Call, Apr 22, 2026 · 2026-04-22T10:30:00 | Kamal Khetan | pending | The margin relates to the current sales mix and has not yet reached revenue recognition. |
| “So it can be close to INR 6,000 to INR 7,000 crores GDV. Close to approximately INR 7,000 crores of GDV.” | Sunteck Realty Limited, Q4 2026 Earnings Call, Apr 22, 2026 · 2026-04-22T10:30:00 | Kamal Khetan | pending | Management immediately clarified that Nepean Sea Road, BKC and existing inventory were additional to this launch pipeline. |
Q&A pressure map
Question counts and firms are curator tallies; analyst coverage shown above.
| Topic | Questions | Firms | Pressure / response |
|---|---|---|---|
| Nepean Sea Road and RERA | 42 | Antique Stockbroking Ltd., Research Division, Arihant Capital Markets Ltd., Research Division, Axis Capital Limited, Research Division, CLSA Limited, Research Division, Emkay Global Financial Services Ltd., Research Division, ICICI Securities Limited, Research Division, IIFL Research, Investec Bank plc, Research Division, JM Financial Institutional Securities Limited, Research Division, Jefferies LLC, Research Division, Kotak Securities (Institutional Equities), Motilal Oswal Securities Limited, Research Division, Sharekhan Limited, Research Division | Questions covered launch timing, project enlargement, the basis of presales before RERA and the start of construction. The RERA sequence in Q3 FY '26 required repeated follow-ups: early answers discussed tenant allotments before management gave an approval window. |
| Presales and growth guidance | 33 | Anand Rathi Shares and Stock Brokers Limited, Research Division, Antique Stockbroking Ltd., Research Division, Arihant Capital Markets Ltd., Research Division, Axis Capital Limited, Research Division, CLSA Limited, Research Division, Emkay Global Financial Services Ltd., Research Division, HSBC Global Investment Research, Investec Bank plc, Research Division, JM Financial Institutional Securities Limited, Research Division, Jefferies LLC, Research Division, Kotak Securities (Institutional Equities), Motilal Oswal Securities Limited, Research Division, Nuvama Wealth Management Limited, Research Division, Sharekhan Limited, Research Division | Analysts repeatedly tested which projects and segments support the growth target and whether Dubai is necessary. The latest call made the ex-Dubai commitment explicit but still relies on a broad MMR launch schedule. |
| Dubai timing and economics | 23 | Antique Stockbroking Ltd., Research Division, Arihant Capital Markets Ltd., Research Division, Axis Capital Limited, Research Division, CLSA Limited, Research Division, Emkay Global Financial Services Ltd., Research Division, Equirus Securities Private Limited, Research Division, HSBC Global Investment Research, JM Financial Institutional Securities Limited, Research Division, Jefferies LLC, Research Division | Launch timing, phasing, investment and sales contribution recurred throughout the recent history. The latest answer was direct that timing now depends on the Middle East conflict settling, while demand commentary was explicitly treated as speculative. |
| Collections and cash conversion | 15 | Axis Capital Limited, Research Division, CLSA Limited, Research Division, HSBC Global Investment Research, Investec Bank plc, Research Division, JM Financial Institutional Securities Limited, Research Division, Motilal Oswal Securities Limited, Research Division, Sharekhan Limited, Research Division | Questions focused on collections lagging presales, project-level contributors and the timing of catch-up. Management generally answered with construction-linked milestones, but exact collection guidance was often withheld. |
| Margins and profitability | 10 | Axis Capital Limited, Research Division, Investec Bank plc, Research Division, JM Financial Institutional Securities Limited, Research Division, Jefferies LLC, Research Division, Motilal Oswal Securities Limited, Research Division | Analysts asked how project mix, new acquisitions and accounting recognition translate into margins. Management's latest distinction between blended margins and lower new-project margins made the framework more specific. |
Language shifts
Only language evidence verified against the referenced component is shown.
| Observation | Verbatim evidence | Call ID | Component |
|---|---|---|---|
| Dubai language moved from calendar confidence to event dependency. | “As far as the launch exact timeline, obviously, we'll have to see that event settling down.” | 1995646825 | 5 |
| Management introduced clearer macro caution before the latest call. | “So market, we all see is slightly fragile, definitely.” | 1978764685 | 38 |
| Pricing language became explicitly restrained at year-end. | “I feel that we should not expect too much of price rise from here.” | 1995646825 | 30 |
| The latest call added supply-chain risk to the operating vocabulary, though management described the issue as temporary. | “But definitely, there is some problem in certain supply chain.” | 1995646825 | 34 |
| Confidence on presales growth strengthened even as Dubai timing became less certain. | “Yes. 100% confident that irrespective of Dubai launch happening or not happening.” | 1995646825 | 47 |
The call history supports the presales and balance-sheet case, but keeps execution risk centered on launch approvals and the conversion of bookings into collections.
Figures converted from INR at historical FX rates — see data/company.json.fx_rates. Ratios, margins, and multiples are unitless and unchanged.
Bottom line
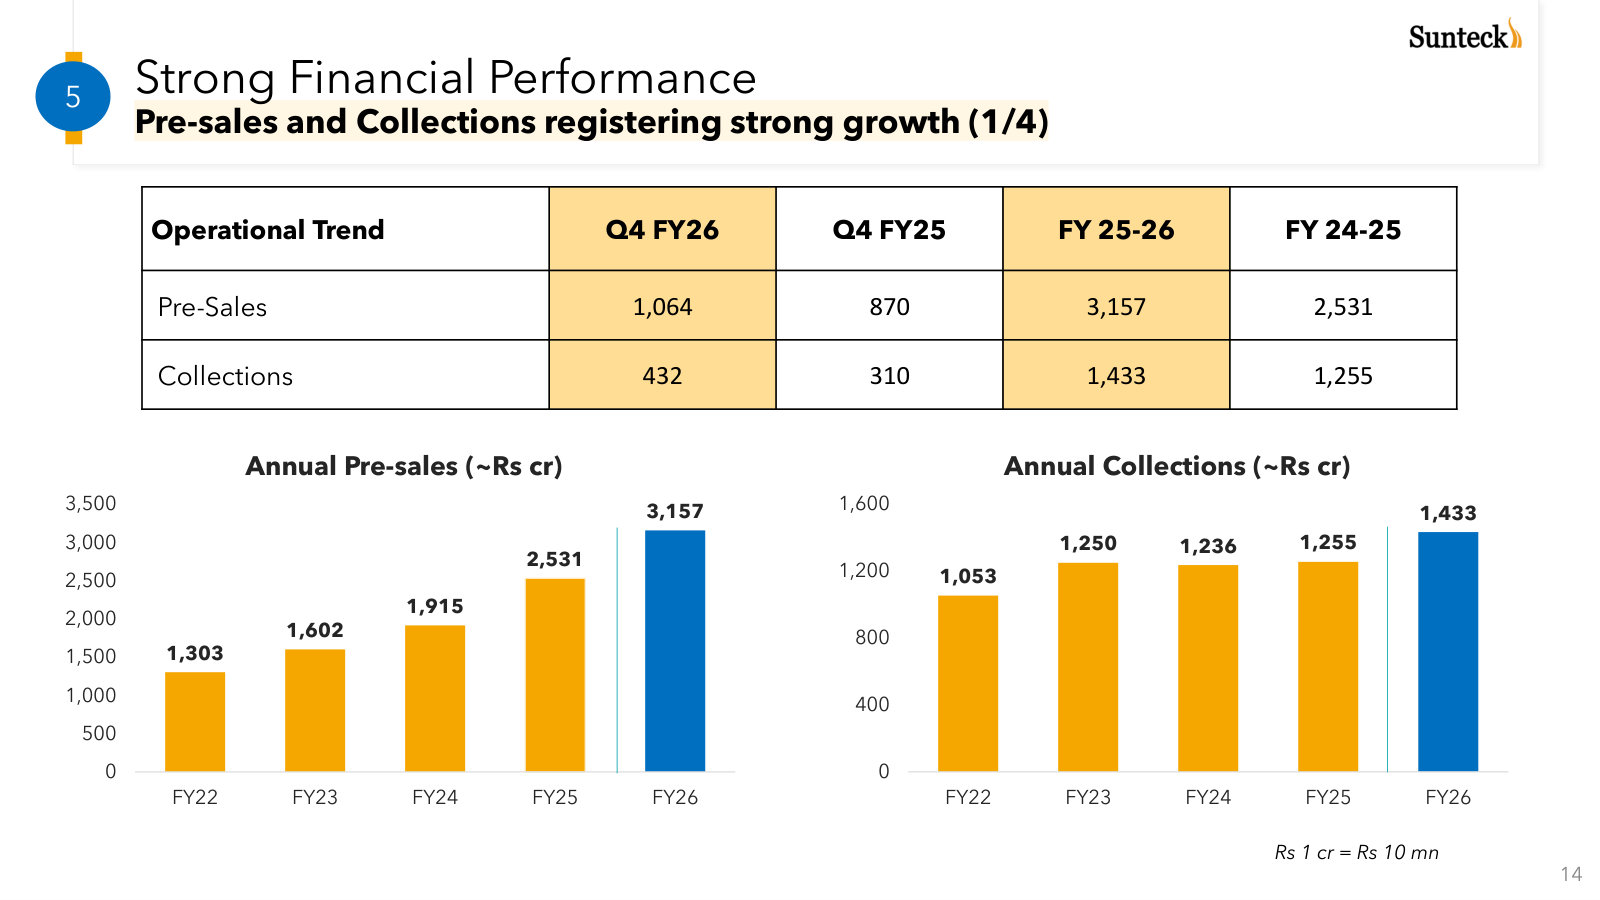
Sunteck is a Mumbai-centred developer whose activity is more visible in pre-sales and collections than in reported revenue. In FY26, Sunteck generated $336.5 million of pre-sales and $152.8 million of collections, or 45.4% of pre-sales, while its reported $58.8 million net cash-flow surplus excluded $86.7 million of business-development, landowner and JDA spend and statutory operating cash flow was negative $46.1 million. [1][2][3] Management reported 80% H1 FY26 collection efficiency on ongoing and completed projects [4], but that measure has a different denominator: it tracks cash collected against scheduled demands for a project cohort, whereas 45.4% compares total FY26 collections with total FY26 pre-sales across booking vintages.
A development platform
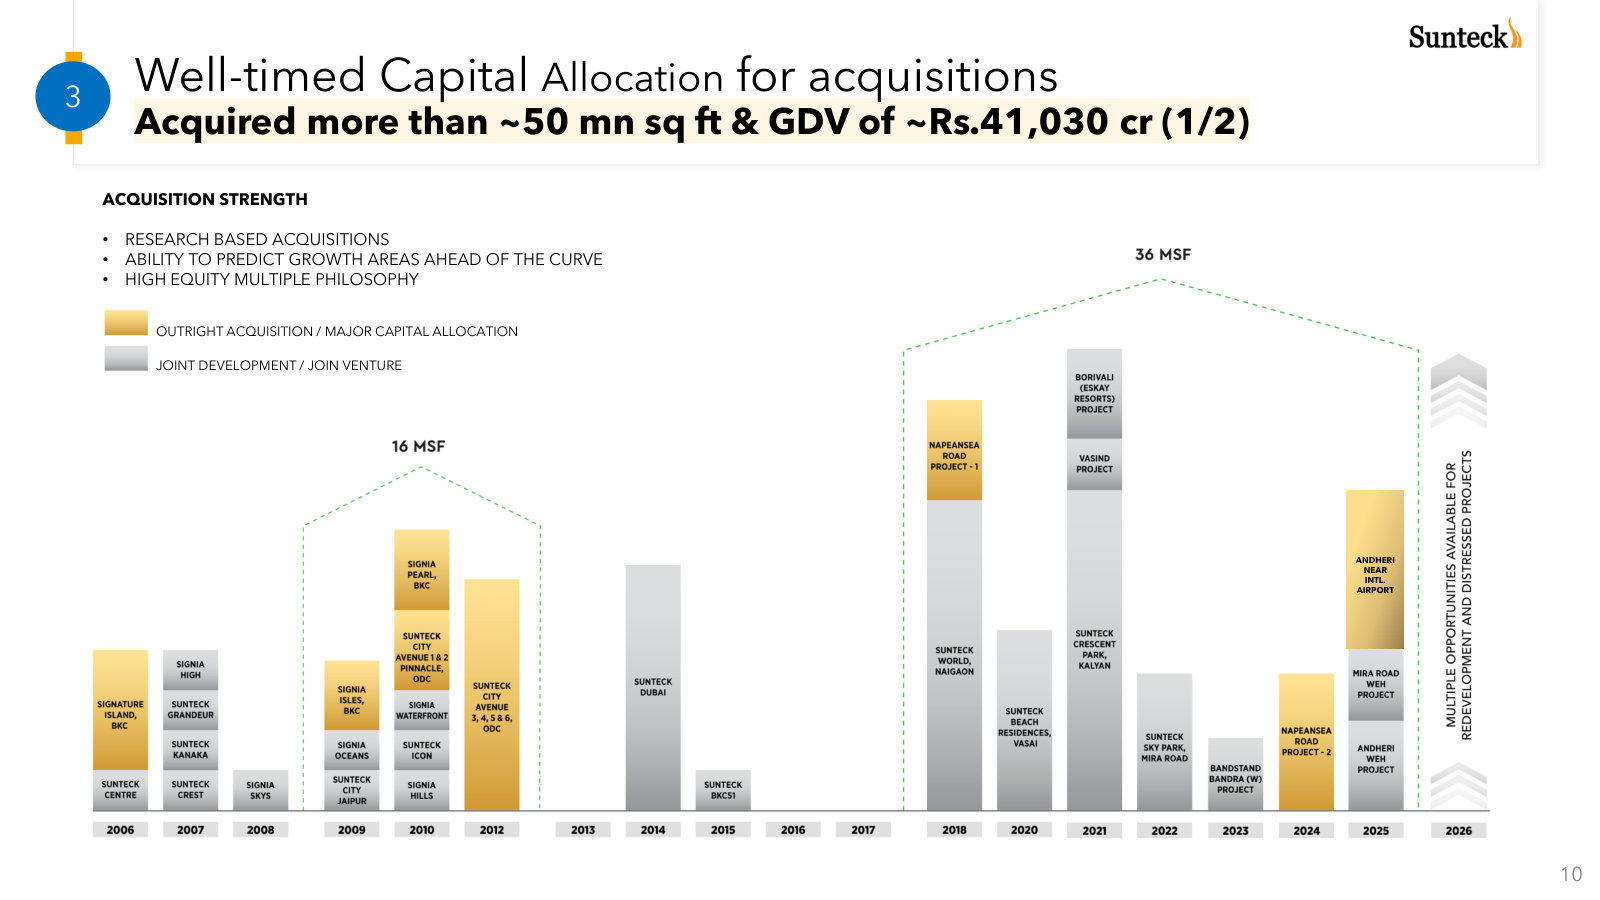
Sunteck Realty develops and sells mostly residential property across the Mumbai Metropolitan Region, with a smaller commercial annuity business [5]. The FY25 annual report described more than 50 million square feet across 32 projects and brands spanning aspirational through ultra-luxury housing [6]. By FY26, management counted 20 delivered projects, more than 50 million square feet of acquisitions and roughly $4.37 billion of balance gross development value, or GDV, across about 13 large projects [7]. Sunteck defines GDV as the development value remaining after sales already made [8].
Balance GDV ($ million)
FY26 pre-sales ($ million)
FY26 revenue ($ million)
FY26 PAT ($ million)
Sources: FY26 operational snapshot [9]; pre-sales [10]; FY26 consolidated results [11].
GDV needs a boundary. It is a measure of potential sales inventory, not audited backlog, net asset value or future profit. The $4.37 billion headline is about 37 times FY26 operating revenue, but construction cost, landowner shares, approvals, launch timing and price realization sit between those figures.
The operating model combines outright land purchases, redevelopment and joint development arrangements, or JDAs [12]. Landowners can contribute development rights in exchange for a share of constructed area or revenue, reducing the developer’s upfront land cheque [13]; Sunteck keeps project construction predominantly in-house [14]. Two commercial buildings, Sunteck BKC51 and Sunteck Icon, provide a separate annuity stream under 29-year single-tenant leases [15]. The residential business remains the driver: premium luxury and uber-luxury plus other projects supplied $304.3 million, or 90%, of FY26 pre-sales [16].
Bookings lead the accounts
Three measures describe different stages of the same economic process. Pre-sales record units booked and indicate demand. Collections record customer cash received as construction and payment milestones progress. Revenue enters the financial statements when the relevant performance obligation is satisfied, either over time when the accounting criteria are met or at a point in time on a completed-contract basis. Customer advances and billings ahead of recognized revenue remain contract liabilities [17]. A booking is thus neither current-period revenue nor current-period cash.
Source: FY26 investor presentation, annual operating trend [18]; converted at the nearest available annual historical FX rates.
In reported currency, pre-sales compounded at 24.8% from FY22 to FY26; collections compounded at 8.0%. Collections equalled 81% of pre-sales in FY22 and 45% in FY26. This is not a delinquency ratio because each year’s collections draw from several booking vintages, but it shows that cash receipts have not kept pace with new bookings.
The detailed statutory cash reconciliation and leverage history are in Financials and Cash.
The strategy itself is not new. In FY21 management said it would sell most of $245.9 million of finished inventory over three to four years and favour low-capex JDAs to keep debt muted [19]. FY26 shows the resulting pipeline at much larger scale; it also makes project-level conversion and the cost of replenishing land more important than the GDV headline.
The share-price record
Source: daily unadjusted closing-price series; closes on 31 March 2021, 31 March 2022, 31 March 2023, 28 March 2024, 28 March 2025, 30 March 2026 and 20 July 2026 [20]; converted at the nearest available historical FX rates. Dividends are excluded.
The stock has not moved in a straight line with bookings. The $3.29 converted close on 20 July 2026 was 14% below the $3.83 converted close on 31 March 2021 and 43% below the $5.77 converted close on 31 March 2022 [21]. Over the latter interval, annual pre-sales rose 142% in reported currency. That divergence creates room for a valuation debate, but does not settle it: collections, project economics and the capital needed to realize GDV determine how much of the operating growth reaches shareholders.
Investment question
The report’s central question is whether Sunteck can convert its fast-growing, MMR-heavy development pipeline into durable cash and recognized earnings while preserving the low leverage that enabled its expansion.
Figures converted from INR at historical FX rates — see data/company.json.fx_rates. Ratios, margins, and multiples are unitless and unchanged.
Cash conversion boundary
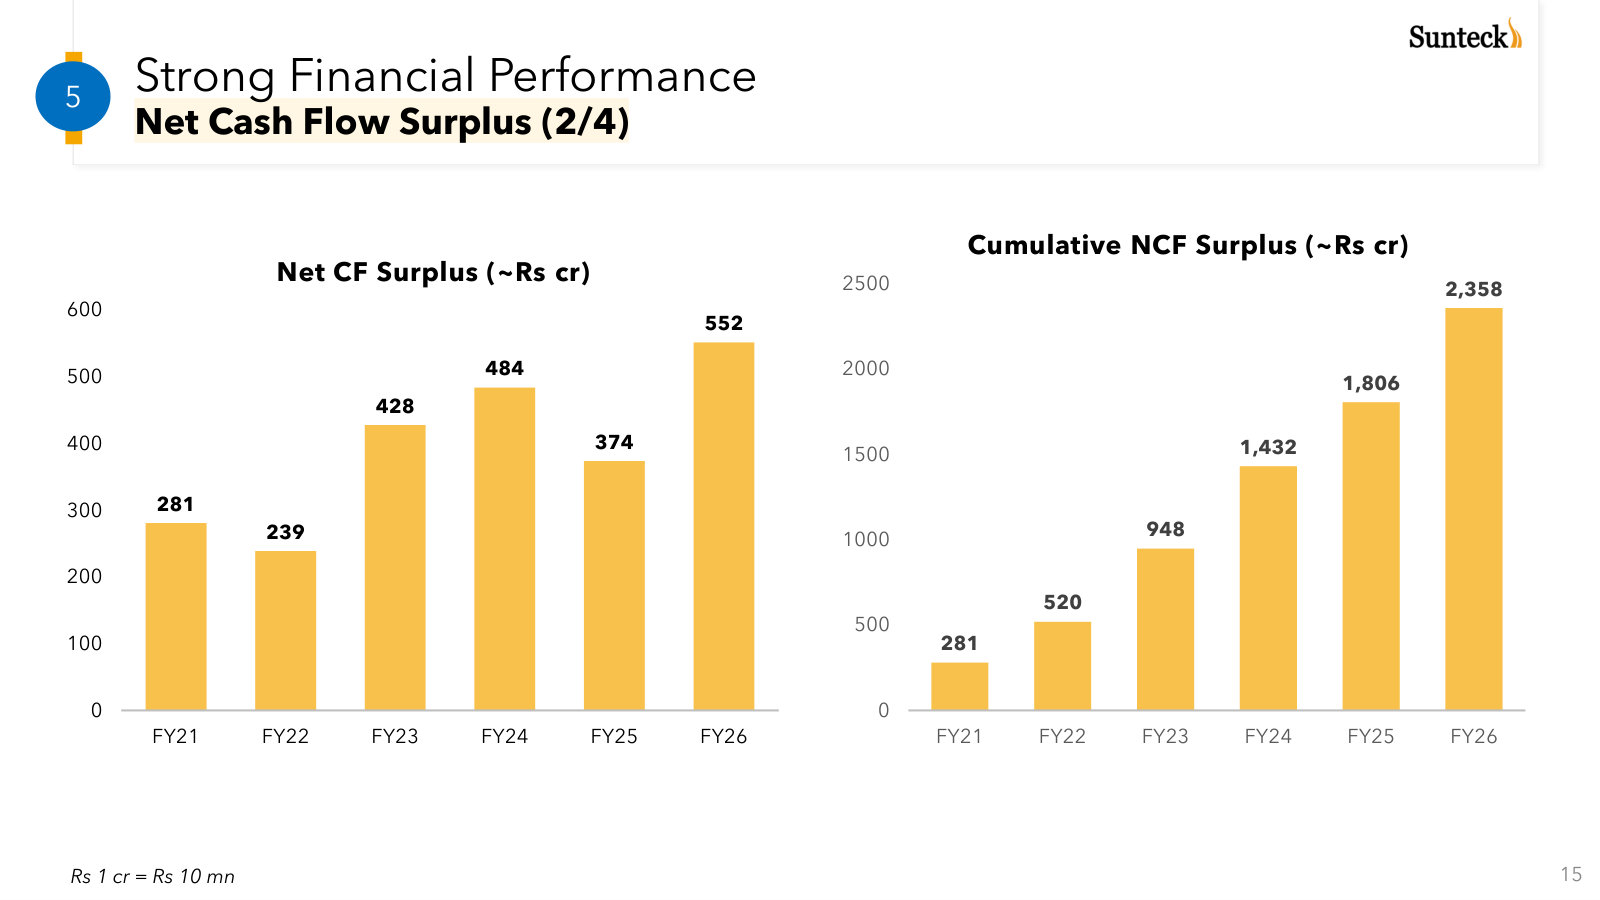
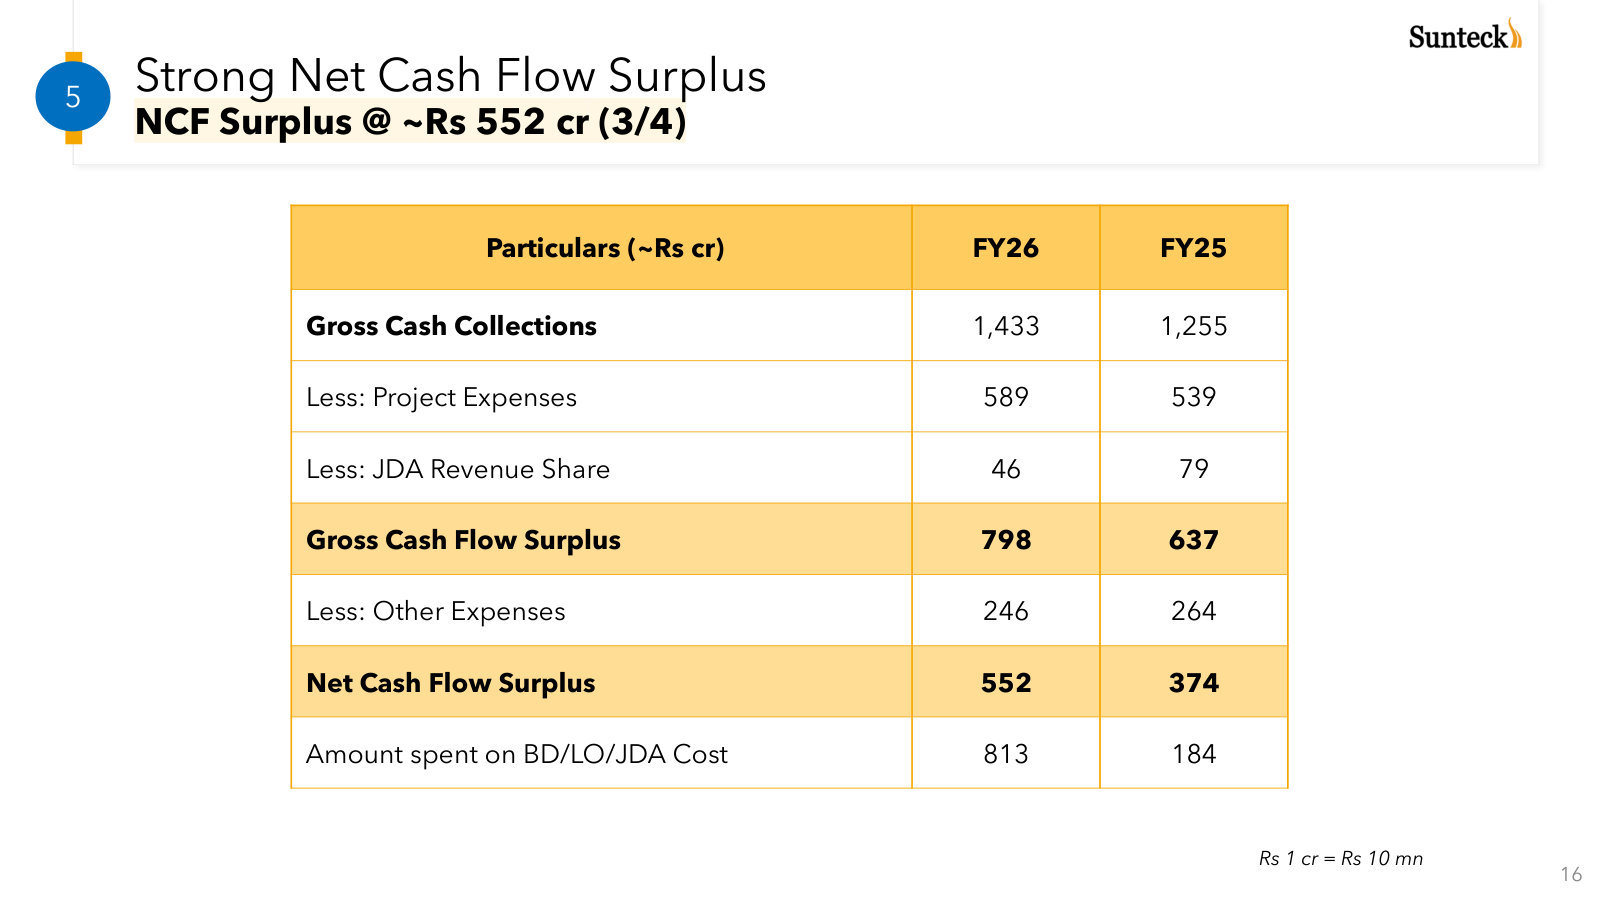
In FY26, Sunteck generated $336.5 million of pre-sales and $152.8 million of collections, or 45.4% of pre-sales, while its reported $58.8 million net cash-flow surplus excluded $86.7 million of business-development, landowner and JDA spend and statutory operating cash flow was negative $46.2 million. [22] [3] [2]
The 45.4% annual collections/pre-sales ratio compares all FY26 collections with all FY26 pre-sales; it is not a delinquency ratio or a project-cohort collection-efficiency measure. Management reported 80% H1 FY26 collection efficiency on ongoing and completed projects [23]. Its denominator is instalments due on those projects, unlike the annual ratio's total pre-sales denominator, so both measures can be true at once.
At management's indicated 25% FY27 pre-sales growth [24], the $336.5 million base implies $410.1 million of pre-sales. Collections must exceed $205.0 million—37.7% above FY26—to exceed 50% of that target. Statutory operating cash flow must exceed $10.8 million to reverse the FY24–FY26 cumulative deficit [2].
Three years of recovery
The booking and recognition distinction is set out in the Sunteck Primer. The statutory record shows what has reached the accounts: FY24–FY26 revenue rose 99%, PAT rose 185%, and PAT margin increased from 13% to 18%. Cash moved differently.
Sources: FY24–FY26 reported income [5]; BSE-filed cash-flow series [6]; BSE-filed balance-sheet series [7].
FY26 created a $67.6 million gap between PAT and operating cash flow, equal to 7.0% of average assets. Over FY24–FY26, cumulative PAT was $47.6 million while cumulative operating cash flow was negative $10.8 million, a conversion ratio of negative 0.32 times. A longer window is less severe but still incomplete: FY22–FY26 operating cash flow equalled 0.22 times cumulative PAT, while free cash flow equalled negative 0.43 times [8] [9]. The lifecycle makes single-year conversion volatile, but the five-year sum avoids judging the company on FY26 alone.
Two definitions of cash
Sources: company-defined net cash-flow surplus [10]; statutory operating cash flow from BSE filings [11].
The management measure answers a narrower question than statutory operating cash flow. It deducts $62.8 million of project expenses, $4.9 million of JDA revenue share and $26.2 million of other expenses from $152.8 million of collections to reach $58.8 million. The same table then discloses $86.7 million spent on business development, landowners and JDAs below that subtotal [12]. Deducting that spend produces a $27.8 million outflow. The disclosure does not reconcile the remaining $18.3 million difference to statutory operating cash flow; the table does not show whether taxes, other working-capital movements or classification differences explain the gap. The surplus is useful for project-level operating progress, but not a substitute for the cash-flow statement.
Inventory carries the cycle
FY26 inventory increased $115.5 million to $841.7 million, or 80% of total assets, while receivables fell 4% to $12.0 million [13]. This points to land and construction investment rather than unpaid recognized revenue as the main cash user. Receivables fell from 189 days of revenue in FY24 to 37 days in FY26, although that ratio is only directional because property revenue is recognized around project milestones and possession.
The latest full annual audit shows what the inventory balance contains. At FY25, it comprised $65.6 million of finished property, $353.0 million of land and development rights, and $306.2 million of construction work in progress [14]. The auditor treated recoverability as a key audit matter because expected launch dates, selling prices and remaining construction costs determine net realizable value [15]. FY26's larger balance, before a full annual-report note breakdown, therefore carries both future revenue capacity and estimate risk.
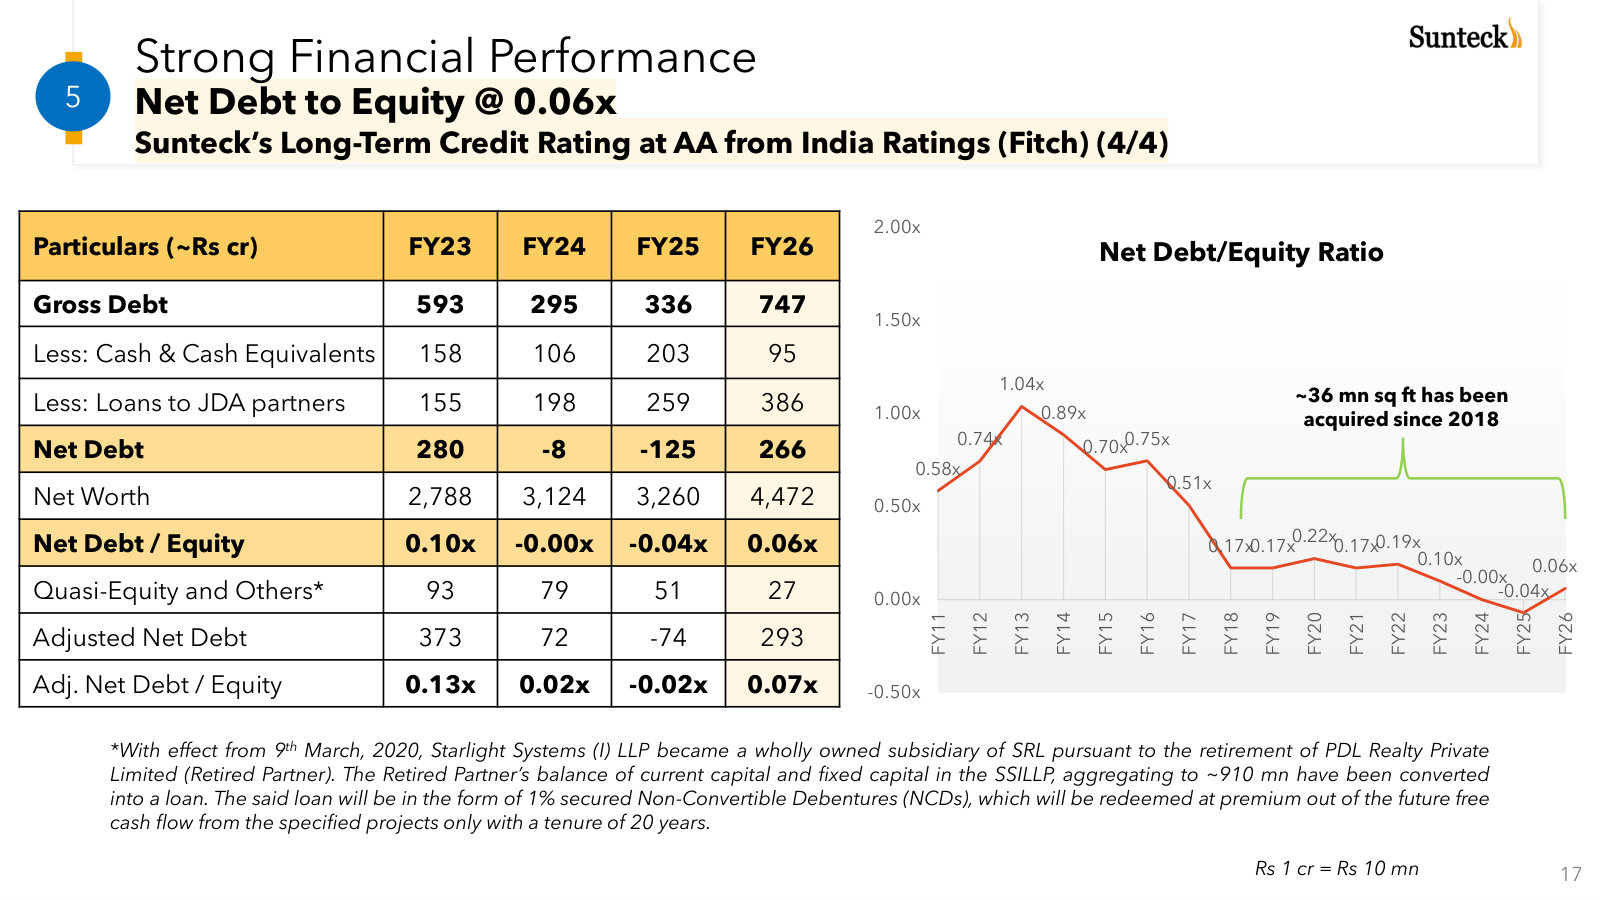
Leverage still provides room. The company's bridge shows FY26 gross debt of $79.6 million, less $10.1 million of cash and $41.1 million of loans to JDA partners, for $28.4 million of net debt. Adding $2.9 million of quasi-equity and other obligations gives adjusted net debt of $31.2 million, or 0.07 times equity [16]. The balance-sheet presentation reports $82.5 million of borrowings, exactly the $79.6 million gross-debt bridge plus that $2.9 million adjustment [17]. The capital structure is not presently stretched, but gross debt more than doubled from FY25 as inventory expanded.
Consensus requires another step-up
Source: consensus estimates as of 21 July 2026 [18].
Average estimates call for revenue growth of 33% in FY27 and 18% in FY28, with EPS growth of 36% and 18%, respectively [19]. Dispersion is wide: FY28 EPS ranges from $0.17 to $0.35. The direction of revisions is less supportive than the averages; FY27 EPS is 12% below its level 90 days earlier and FY28 is 16% lower [20]. Consensus expects the income statement to keep catching up, but provides no forecast for statutory cash flow.
The most useful FY27 confirmation would be statutory operating cash flow above $13.9 million, enough to turn FY24–FY27 cumulative conversion positive. Management expects collections and cash flow to strengthen in FY27 and FY28 [21]. Positive cash flow alongside adjusted net debt below 0.1 times equity would support the view that FY26 funded a new project cycle; another operating outflow with rising inventory and gross debt would not.
Figures converted from INR at historical FX rates — see data/company.json.fx_rates. Ratios, margins, and multiples are unitless and unchanged.
Bottom line
At FY26 close, $1.95 billion, or 44.5%, of Sunteck's $4.37 billion balance GDV was still upcoming, while launched GDV had contracted year on year [1]. My read is that the portfolio has scale but not yet a defensible NAV: launch timing and project-level economics remain unreported. The counterweight is $2.43 billion already launched. Formal launches and disclosed net economics for the largest upcoming projects would change that read.
The mix beneath GDV
The Sunteck Primer defines balance gross development value, or GDV, as potential value excluding sales already made. The additional decision variable is status. From FY25 to FY26, launched balance GDV fell from $2.90 billion to $2.43 billion, while upcoming GDV increased from $1.71 billion to $1.95 billion. The upcoming share therefore rose from 37.1% to 44.5% [2].
Source: company-classified launched and upcoming balance GDV [3].
New acquisitions more than replaced sales depletion in the headline total, but did not replenish the launched pool. This distinction matters because an upcoming project still requires some combination of design, approvals, registration and market launch before its GDV can begin converting on normal terms.
Source: FY26 project-level balance GDV and company launch classification; shares are calculated from $4.37 billion [4].
The concentration cuts both ways. Dubai is the largest single project at $959 million, or 21.9% of total balance GDV, and remains upcoming. Kalyan is almost as large at $938 million but is launched. Together they represent 43.3% of the portfolio, yet sit at very different conversion stages [5]. Excluding Dubai, the upcoming pool is $988 million; the launch issue is broader than one project, but Dubai materially raises its weight.
Launch cadence
At the Q1 FY26 call, management targeted $1.28 billion of new launches over the remaining three quarters [6]. The list included ODC Fifth Avenue, Bandra, Andheri near the Western Express Highway, Mira Road, Vasai, Naigaon and Nepean Sea Road [7].
By Q3, management described ODC Fifth Avenue as effectively launched and a $45–56 million Naigaon phase as launched [8]. Nepean Sea Road was already recording allocations to existing tenants, but had not received RERA approval for open-market sales [9]. At the year-end call, Andheri, additional Mira Road, Vasai and Naigaon phases were again described as launches for the next 12 months, with $640–746 million of GDV indicated apart from the uncertain Dubai timing [10].
The company did not publish a final like-for-like FY26 launch tally, so the $1.28 billion target cannot be scored precisely. The status record nevertheless shows that several named components moved into the following year's plan. Nepean also shows why launch labels need care: tenancy allocations produced pre-sales before a standard RERA launch, so neither an upcoming label nor reported bookings alone gives a complete view of conversion readiness.
From gross value to economics
Sunteck's accounting policy explains the first deduction from GDV. In a JDA, the landowner can receive a percentage of constructed area or revenue proceeds, and the corresponding development right is measured and accounted for when the project launches [11]. The presentation does not give the project-level landowner share, remaining construction cost, selling cost or Sunteck economic interest for the 13-project GDV table [12].
Those omissions are economically material rather than presentational. The FY25 auditor tested inventory recoverability using expected project launch dates, future selling prices, selling costs and construction costs to complete [13]. These are the same inputs needed to turn gross selling value into a project NAV. The Financial Trajectory establishes how much capital the current build-out has already absorbed; this chapter's boundary is that the available project disclosure cannot allocate that capital or its expected return across the GDV pool.
Management's counter-case is a margin framework: it guided to 30–35% EBITDA margins on recent projects and 35–40% on the FY26 pre-sales blend [14]. If delivered, those economics would support value creation. They are not project-specific forecasts, however, and do not resolve ownership share or timing.
The most useful FY27 evidence would be a launched balance-GDV pool above $2.43 billion and an upcoming share below 35%, achieved through formal project launches rather than fresh additions to the denominator. Project-level area or revenue shares and cost-to-complete disclosure would then make a defensible NAV bridge possible. If upcoming GDV remains near 45% while the headline grows through acquisitions, execution risk will remain embedded in the reported scale.
Figures converted from Indian rupees at historical FX rates — see data/company.json.fx_rates. Ratios, margins, and multiples are unitless and unchanged.
Bottom line
MMR remains supportive, but its growth pulse has matured: FY26 sales fell 2% as launches fell 10% [1]. Sunteck's pre-sales rose 25% [2], ahead of Lodha's 11% MMR growth [3] but behind Rustomjee's 33% [4]. The evidence supports capable execution into premiumization, not a distinct moat.
From rebound to balance
The starting point was unusually favorable. In H1 2021, MMR sales rebounded 53% and unsold inventory fell 12% [5], while weighted-average prices remained 17% below their 2016 peak and Sunteck's annual report described affordability as being at a high [6]. That was a cyclical reset. By FY24, the region was already selling 90,314 homes [7], and Mumbai sales above $599,500 had doubled [8] to more than 3,000 units [9].
Sources: Sunteck FY2024 and FY2025 annual reports [10] [11]; Kolte-Patil FY2026 annual report [12].
FY25 extended the advance, but FY26 did not. Unit sales rose 7.8% in FY25 and then slipped 2.0%. The latest decline is modest, and supply adjusted faster: sales exceeded launches by 8,544 units in FY26, compared with 461 units in FY25. That is a constructive inventory setup rather than evidence of accelerating demand.
FY26 sales (units)
FY26 launches (units)
CY25 price ($/sq ft)
CY25 quarters to sell
Sources: FY26 MMR sales and launches [13]; CY25 price and inventory metrics [14] [15].
Calendar 2025 provides the counterweight. Mumbai sales grew 1% [16] and launches fell 10% [17], while residential prices increased 7% [18]. Unsold stock still declined 6% to 155,604 units and quarters to sell remained 6.4 [19]. Supply discipline has kept the market balanced, but further price growth without volume growth would make affordability a restraint rather than a support.
Premiumization fits Sunteck
The market mix is favorable for Sunteck's existing positioning. In Q1 2026, homes priced between $106,600 and $319,800 represented 48% of Mumbai launches, while luxury and high-end homes contributed another 27%; the share below $53,300 declined [20]. Sunteck's segment exposure is detailed in the Sunteck Primer; the portfolio leans into the same premiumization rather than waiting for a broad affordable-housing recovery.
The infrastructure fit is also direct. Metro Line 3 now links BKC, Worli, the airport and SEEPZ, while the Coastal Road and Atal Setu are operational; planned links extend connectivity toward western and peripheral nodes [21]. Those corridors overlap Sunteck's BKC, Goregaon, Mira Road, Vasai, Naigaon and Kalyan exposure [22]. Infrastructure can broaden the addressable market, but it benefits competing landowners and developers in the same micro-markets.
Execution without exclusivity
Sources: Sunteck FY2026 investor presentation [23]; Rustomjee Q4 FY2026 earnings call [24]; Lodha FY2026 annual report [25].
Sunteck outgrew regional unit sales and Lodha's much larger MMR business in FY26, but Rustomjee grew faster from a comparable MMR base. This supports a favorable execution read for the year, not a durable competitive advantage. The comparison excludes Oberoi Realty: its business overview reports annual RERA area sold and cumulative project sales values rather than a standardized annual pre-sales value [26].
Branded-developer consolidation is real but shared. Landowners, customers and lenders increasingly favor established operators, improving access to JDAs and finance [27]. The same conditions attract large, well-capitalized entrants and intensify competition for land and market share [28]. The corpus provides no comparable repeat-buyer, pricing-premium or project-level return series for Sunteck, so switching costs and brand economics are not established.
Decision markers
The constructive read holds if FY27 MMR sales remain broadly stable, quarters to sell stay near or below 6.4, and Sunteck continues to grow pre-sales faster than the regional market without sacrificing collections. A rise above eight quarters to sell alongside another volume decline would weaken the demand premise. Sustained Sunteck share gains across two years, coupled with better statutory cash conversion in Financial Trajectory, would be the evidence needed to move the competitive assessment beyond execution.
Figures converted from INR at historical FX rates — see data/company.json.fx_rates. Ratios, margins, and multiples are unitless and unchanged.
Bottom line
Promoter alignment is substantial, but expansion remains the governing incentive. Before the 2025 warrant proposal, the promoter group held 63.3% of Sunteck [1] and proposed to commit $37.4 million, two-thirds of the raise [2]; Kamal Khetan’s FY25 pay was $0.47 million of salary, with no bonus, stock options or commission shown [3]. The counterweight is governance concentration: Khetan combines the chair and managing-director roles [4]. Equity exposure is clear; project-level returns remain the missing test.
Promoter holding, Aug. 2025
Proposed promoter warrant commitment ($ million)
FY25 MD pay ($ million)
Sources: FY2025 Annual Report, preferential issue shareholding [5], promoter contribution [6] and director remuneration [7].
Ownership and control
Sources: FY2021 promoter share of 67.15% [8]; FY2022 promoter share of 67.13% [9]; FY2023 promoter table [10]; FY2025 promoter table, including FY2024 comparative [11].
The four-point reduction in FY24 is largely explained by two wholly owned subsidiaries selling six million treasury shares that had previously appeared in the promoter table [12]. By March 2025, three promoter trusts—Matrabhav Trust, Paripurna Trust and Astha Trust—alone held 55.7%, while the total promoter position was 63.28% [13]. This is meaningful economic exposure, though control and minority-shareholder alignment are not interchangeable.
Pay design
Sources: reported MD pay and pay-to-median ratios in FY2021 ($0.34 million; source amount ₹252.00 lakh) [14] [15], FY2022 ($0.33 million; source amount ₹252.00 lakh) [16] [17], FY2023 [18] [19], FY2024 [20] [21] and FY2025 ($0.47 million; source amount ₹404.55 lakh) [22] [23].
Across five years, Khetan’s fixed pay rose 61%, including 45% in FY25, while the reported pay-to-median ratio fell from 36.92x to 25.20x [24] [25] [26] [27]. The ratio trend tempers the absolute increase, but Khetan’s FY25 managing-director row shows no bonus, stock options or commission, and the filing discloses no formula tying his pay to cash conversion, return on equity or project returns [28]. The $0.47 million payment equalled 2.7% of FY25 consolidated profit after tax of $17.6 million [29].
Expansion capital
Khetan’s FY21 commitment was specific: sell most of $245.9 million of finished inventory, favor low-capex JDAs, and buy land only when compelling enough to preserve muted debt [30]. Four years later, the company proposed a $56.3 million preferential warrant raise, with 75.2% earmarked for land, development rights and project deployment rather than debt reduction [31].
Source: FY2025 Annual Report, proposed use of warrant proceeds [32].
The $4.79 issue price was only 0.4% above the regulatory 90-day floor of $4.77 [33] [34]. Promoter entities proposed to subscribe for 78.2 lakh warrants and $37.4 million, or 66.5% of the capital [35]. The terms required 25% at allotment and 75% upon conversion, with exercise due within 18 months from warrant allotment and the initial payment forfeited if conversion lapsed [36].
Full conversion would expand the share count by 8.0% and dilute the enlarged base by 7.4%, while promoter ownership would move only from 63.30% to 63.54% [37]. By 31 March 2026, 352,941 warrants, or 3.0% of the proposed warrants, had converted [38]; the percentage uses the warrant count implied by the schedule’s 14,64,89,084 existing and 15,82,53,789 full-conversion share counts [39]. Separately, FY26 cash flow records $12.9 million of net warrant receipts plus $1.6 million of equity-issuance proceeds, meaning $14.5 million, or 27.25% of the $56.3 million issue, had been received and 72.75% remained contingent [40]. The corpus does not disclose the overall warrant-allotment date, so the 18-month condition does not establish an exact expiry date.
Oversight and decision rule
The governance structure supplies real counterweights. Four of six FY25 directors were independent [41], the nomination and remuneration committee’s three independent directors—Chaitanya Dalal, Mukesh Jain and Sandhya Malhotra—each attended 4 of 4 meetings [42], and an external monitoring agency was appointed for the warrant proceeds [43]. Against that, the board met 6 times, with Kamal Khetan attending 4 [44], and Khetan attended none of the six audit-committee meetings despite being a committee member [45].
My read is that Sunteck has credible economic alignment, but its governance design rewards and finances portfolio expansion more clearly than per-project cash returns. The strongest fact against concern is that promoters proposed to commit most of the new capital without materially increasing control, under a majority-independent board and monitored use-of-proceeds framework. Better disclosure of project-level invested capital, realized returns and warrant deployment would improve that read; another land-funded raise before those returns appear would weaken it.
Figures converted from INR at historical FX rates — see data/company.json.fx_rates. Ratios, margins, and multiples are unitless and unchanged.
Bottom line
Management now describes Sunteck as holding 50% of the Dubai project's economic interest [1], implying roughly $539.6 million of gross economic GDV from the $1.08 billion headline before construction costs, tax and timing [2] [3]. A 100%-owned intermediate company and a 50% project economic interest can coexist: the first describes ownership of the corporate vehicle, while the second describes the underlying project economics. The FY26 results list GGICO and Sunteck MAS as subsidiaries from 27 October 2025 [4], but the $91.8 million NCI is group-wide and cannot be assigned wholly to Dubai from the current results [5].
At $3.27, Sunteck's $480.6 million market value is 1.28 times the $384.9 million FY26 equity attributable to shareholders, not 1.03 times the $476.7 million headline group equity, because $91.8 million belongs to non-controlling interests. [6] [7] [8] Valuation Boundaries contains the valuation mechanics; this chapter remains focused on the legal history, consolidation change and missing NCI bridge.
The audited history
The Dubai exposure predates the current project headline. In FY21, the auditor described GGICO Sunteck as a 50%-owned joint venture whose project had been delayed by partner disputes and reciprocal arbitration [9]. Sunteck carried $18.4 million of investment and $5.3 million of loans to the entity [10], and the auditor treated recoverability as a key audit matter [11].
The matter persisted. The FY22 audit recorded a partial arbitration award in the proceeding initiated by Sunteck's subsidiary [12], while FY23 said that award favoured the subsidiary and still described the counterparty proceeding as pending [13]. By FY24, the parties had signed a non-binding memorandum toward settlement [14]. At FY25, investment plus loans reached $23.8 million [15]; the auditor continued to identify impairment assessment as a key audit matter because recovery depended on forecast cash flows and management assumptions [16].
Sources: Sunteck annual reports for FY2021 [17], FY2022 [18], FY2023 [19], FY2024 [20] and FY2025 [21].
The series shows period-end carrying exposure, not fresh cash invested. The FY25 related-party note marks the GGICO loan [22] and payable [23] balances with a foreign-exchange-conversion footnote [24]. The recurring issue is the recoverability judgment, not the visual slope.
The counter-fact is substantive. The parties entered a framework agreement on 26 March 2024, created Sunteck MAS Real Estate Development LLC, signed a joint development and licence agreement in August 2024 and obtained a December court order acknowledging settlement and withdrawal [25]. Yet FY25 used unaudited or unreviewed GGICO financial statements, recorded no share of profit or loss, and retained the carrying value on management's forecast of resumed-project cash flows [26]. The legal position improved; audited project economics did not become visible.
One project, two signals
Management's Q1 FY25 answer contains both ownership descriptions. It said the Dubai project was in a 100%-owned Sunteck subsidiary, that Sunteck had invested about $30.0 million, and that most of the $239.8 million construction cost should be funded from pre-sales [27]. When the analyst then summarized Sunteck's share as 50%, management answered yes [28].
A wholly owned intermediate company and a 50% project interest can coexist. The FY25 financial note says both partners incorporated Sunteck MAS and signed the development agreement, but it does not state the equity split, voting rights or Sunteck-attributable GDV [29]. The FY26 call supplied the 50% economic-interest figure [30], but not the legal and voting split or the NCI bridge. That is the ownership boundary behind the gross-value limitation in Pipeline Economics.
Consolidation without attribution
The FY26 result adds a structural change. GGICO is listed as a joint venture through 26 October 2025 [31] and as a subsidiary from 27 October [32]; Sunteck MAS also appears as a subsidiary from 27 October [33]. The balance sheet's equity section simultaneously introduced $91.8 million of non-controlling interest from zero [34].
FY25 GGICO Interest
FY25 Exposure ($m)
FY26 NCI ($m)
FY26 NCI Cash ($m)
Sources: FY25 GGICO interest [35] and carrying exposure [36]; FY26 balance-sheet non-controlling interest [37]; cash contribution by non-controlling interests [38].
Only $7.0 million of FY26 financing cash flow came from non-controlling interests [39]. NCI was attributed a $0.2 million loss [40] and $5.9 million of other comprehensive income [41]. Consolidated other comprehensive income was largely foreign-currency translation [42]. Those figures show partner economics after consolidation, but the results release does not explain how the $91.8 million opening recognition was calculated. The timing makes Dubai a plausible contributor; without the full FY26 annual-report note, it cannot be assigned entirely to Dubai.
Evidence that would resolve it
The strongest counter-fact concerns funding risk. At the FY26 year-end call, management described the Dubai project as launch-ready and debt-free at project level, and said its low acquisition cost could withstand a 10% to 20% market correction [43]. Together with the settlement, that reduces the immediate impairment and solvency concern.
The remaining disclosure need is narrow: the acquisition-accounting note, ownership and voting rights for GGICO and Sunteck MAS, a bridge for the $91.8 million non-controlling interest, and a reconciliation from Sunteck's stated 50% economic interest to project GDV, cost and cash flow. On management's 50% description, gross attributable GDV starts nearer $539.6 million before construction cost, tax and timing [44]; it is still not NAV.
Figures converted from INR at historical FX rates — see data/company.json.fx_rates. Ratios, margins, and multiples are unitless and unchanged.
The equity that belongs to shareholders
At $3.27, Sunteck's $480.6 million market value is 1.28 times the $384.9 million FY26 equity attributable to shareholders, not 1.03 times the $476.7 million headline group equity, because $91.8 million belongs to non-controlling interests. [1] [2] [3]
The counter-fact cuts both ways: $3.27 was 25.9% below the $4.79 warrant price [4], while promoter entities represented 66.5% of proposed capital [5].
The stock also trades at 16.6 times FY27 consensus EPS of $0.20 [6]. A sustained move toward 10% ROE and positive statutory cash flow without higher leverage would improve the range; more estimate cuts would weaken it. Project-level NAV inputs remain unavailable, so book and earnings sensitivities are more honest than a point target.
Current Price ($)
Equity Value ($m)
Price / Attributable Book
FY27 Consensus P/E
Sources: market price and FY27 consensus EPS as of 21 July 2026 [7]; FY26 paid-up equity capital and earnings per share [8]; FY26 equity attributable to shareholders [9].
The $480.6 million equity value uses 14.6842 crore shares, matching FY26 paid-up capital at $0.01 face value [10]. Sunteck reported $476.7 million of total group equity, but only $384.9 million was attributable to shareholders; the $91.8 million difference was non-controlling interest [11]. The stock is therefore at 1.03 times total group equity but 1.28 times the book value belonging to common shareholders. The latter is the relevant denominator.
That distinction also changes the growth rate: total group equity rose 37.2% in FY26, while equity attributable to shareholders rose 10.8% [12]; GGICO Sunteck's FY26 reclassification from joint venture to subsidiary makes Dubai consolidation a plausible contributor [13], with the ownership and NCI bridge addressed in Dubai Attribution.
Earnings need a cycle adjustment
Sources: FY19–FY26 reported EPS [14]; FY27–FY28 consensus EPS as of 21 July 2026 [15].
At the current price, the stock is on 22.6 times FY26 EPS, 16.6 times FY27 consensus and 14.0 times FY28 consensus. The three-year average of FY24–FY26 native-currency EPS implies a 32.4 times multiple. This spread is the cost of using completion-led earnings: a single year can be either a trough or a release of prior bookings.
The cash check remains important. FY26 statutory profit after tax was $21.5 million while operating cash flow was negative $46.1 million [16] [17]. The working-capital mechanism is reconciled in Financial Trajectory; for valuation, it means FY26 earnings should not receive a cash-compounder multiple without a reversal in statutory cash flow.
Book value needs a return
Sources: Sunteck [18]; Rustomjee [19]; Oberoi Realty [20]; Lodha [21].
Sunteck’s FY26 ROE improved to 5.6%, above Rustomjee’s 3.3% but well below Oberoi Realty’s 14.0% and Lodha’s 14.7% [22] [23] [24] [25]. These are not identical businesses: Oberoi has more annuity income [26] and Lodha has much greater scale [27]. The comparison is useful only as a return-on-book cross-check, not as a peer fair-value mark.
Two valuation frames
Source: derived from FY26 equity attributable to shareholders and share capital [28] [29], and FY27–FY28 consensus EPS [30]. Multiples are sensitivities, not forecasts.
A 20% haircut to attributable book reduces the 1.0x, 1.25x and 1.5x per-share values from $2.56, $3.19 and $3.83 to $2.04, $2.56 and $3.07, respectively.
The $3.27 market price sits close to 1.25 times FY26 attributable book and 16 times FY27 consensus EPS. The same 16 times applied to FY28 yields $3.74, but that outcome requires the forecast EPS increase to arrive. The range is most sensitive to sustainable ROE and cash conversion, not to published gross development value; Pipeline Economics explains why GDV cannot be used as NAV.
The warrant reference
The September 2025 warrants provide a dated capital-market check. They were offered at $4.79, just 0.4% above the $4.77 regulatory floor based on the preceding 90 trading days [31] [32]. The current native-currency price is 25.9% lower. This is supportive evidence, but not an independent appraisal: promoter entities proposed to fund 66.5% of the issue [33], and FY26 share capital remained far below the 15.8254 crore shares that full conversion would have produced [34] [35]. The financing context is covered in Promoter Stewardship.
Consensus has moved lower but still assumes growth. FY27 EPS fell 11.7% over 90 days to $0.20 (₹18.9806 in the source data), while FY28 fell 16.0% to $0.23 (₹22.4874 in the source data) [36]. The relevant monitoring test is specific: attributable ROE moving into double digits, statutory operating cash flow turning positive, and FY27 EPS holding near the current estimate without a material increase in net debt.
Figures converted from INR at historical FX rates — see data/company.json.fx_rates. Ratios, margins, and multiples are unitless and unchanged.
FY27 should be judged on conversion rather than another expansion claim. Management has indicated roughly 25% pre-sales growth, a launch slate of about $727.3 million (₹7,000 crore) plus Nepean Sea Road, and a better collections ratio [1][2]. Low adjusted leverage and 80% H1 collection efficiency on ongoing and completed projects are the counter-evidence to the cash-flow concern [3][4]. The read improves only if those launches arrive while statutory operating cash flow turns positive.
The next twelve months
The operational bar is more demanding than the earnings bar. Consensus as of 21 July 2026 expected FY27 revenue growth of 33.1% [5] and EPS growth of 36.2% [6], but it supplied no estimate for pre-sales, collections or statutory cash flow. Those three lines determine whether the pipeline described in Pipeline Economics is becoming self-funded value.
Sources: Q4 FY2026 GDV and collections commentary [7], and 25% pre-sales growth without Dubai and 50% Dubai economic interest [8]. Management also expected Nepean construction progress in the first two quarters [9]. FY26 pre-sales and collections [10], statutory operating cash flow [11], the 3.0%-conversion and 27.25%-cash-receipt markers [12][13][14], $91.8 million non-controlling interest [15], and FY25 warrant terms [16][17]. Thresholds are analytical, not company guidance.
The implied pre-sales target is simple native-currency arithmetic. Converted at the applicable rates, the FY26 base is $336.5 million and the FY27 target is $410.0 million. Matching 25% growth in collections would leave the annual collections-to-pre-sales ratio unchanged at 45.4%; reaching 50% requires $205.0 million, or 37.7% collection growth. That ratio is not a cohort measure. Management reported 80% H1 FY26 collection efficiency on ongoing and completed projects [18], so the annual gap can reflect booking mix as well as collection execution.
Shared facts, different readings
Sources: FY27 improved-collections and $727.3 million launch commentary [19], plus 25% growth without Dubai and 50% Dubai economic interest [20]. Management also expected Nepean construction progress in the first two quarters [21]. FY26 pre-sales and collections [22], statutory operating cash flow [23], the 3.0%-conversion and 27.25%-cash-receipt markers [24][25], $91.8 million non-controlling interest [26], and warrant terms [27][28].
At 31 March 2026, the share-capital and financing-cash-flow disclosures imply that 3.0% of the warrants had converted while 27.25% of the issue cash had been received [29][30][31]. The remaining exercise would add 7.8% to the FY26 share count and bring $37.8 million of cash consideration [32][33]. The filing does not state the allotment date, so the exact 18-month expiry remains undisclosed [34].
Scenario reconciliation
The constructive path combines management's roughly 25% pre-sales growth with collections above $205.0 million, positive statutory operating cash flow, adjusted net debt to equity no higher than 0.10x, and the promised H1 project milestones. A mixed path is booking growth with collections still below 50% of pre-sales or another statutory cash outflow; the timing explanation would remain plausible, but not proven. The adverse path is launch slippage alongside negative cash flow and rising leverage, especially if warrant proceeds add inventory without disclosed owner-attributable returns.
The annual collections ratio is an intentionally simple monitor, not a substitute for the project-level cohort schedule that the company does not disclose. No single threshold settles the case. The combined pattern across launches, collections, statutory cash flow, leverage, warrant conversion and non-controlling interests is the useful evidence set.